


33 seconds ago
![]() calvintaneng Latest good news from Tsh
calvintaneng Latest good news from Tsh
Director Kelvin Tan bought 14 million Tsh shares to...
10 minutes ago
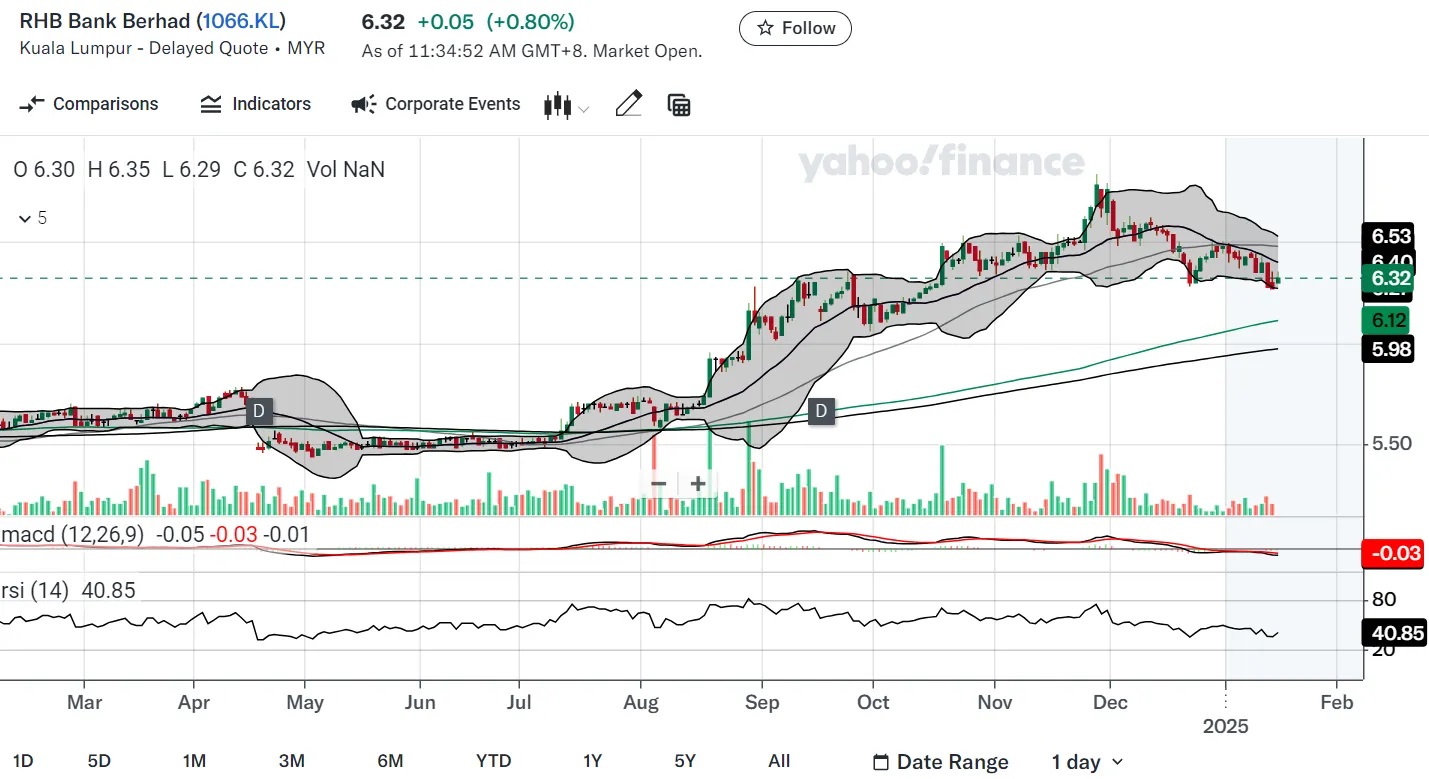
![]() pang72 I do t know where it heading.. $10 is possible too since broken 3 years low
pang72 I do t know where it heading.. $10 is possible too since broken 3 years low
General healmeprostatesupport.sites.kaltura.com/
https://healme-prostate-support.sites.kaltura.com/
General healmeprostatesupport.sites.kaltura.com/
https://healme-prostate-support.sites.kaltura.com/
https://healmeprostatesuppo...
General healmeprostatesupport.sites.kaltura.com/
https://healme-prostate-support.sites.kaltura.com/
General healmeprostatesupport.sites.kaltura.com/
https://healme-prostate-support.sites.kaltura.com/
https://healmeprostatesuppo...
General healmeprostatesupport.sites.kaltura.com/
healmeprostatesupport.sites.kaltura.com/
News & Blogs Blog: Answer & Win: MQ Trader's Christmas Campaign
As a student always looking for ways to improve my writing process, I was thri...
News & Blogs Blog: M & A Value Partners launches M & A Value Partners IPO Equity Fund - Targeted 13% Return p.a
If you're looking for a great way to unwind, stand up comedy edmonton https://...
News & Blogs Blog: What other i3 investors forum members said about Calvin Tan (unsolicited comments through the years)
Another one got mental problem is Sidney Oon of SEE_Research from Puchong
emo...
mplus313 . 2025-01-15
Bxtrade . 2025-01-15
Patriciaa . 2025-01-15
MQ Trader . 2025-01-15
Futurescoin . 2025-01-15
Daily Futures Trading Strategy 15 Jan 2025 - Global Market Index
MHAB1990 . 2025-01-15
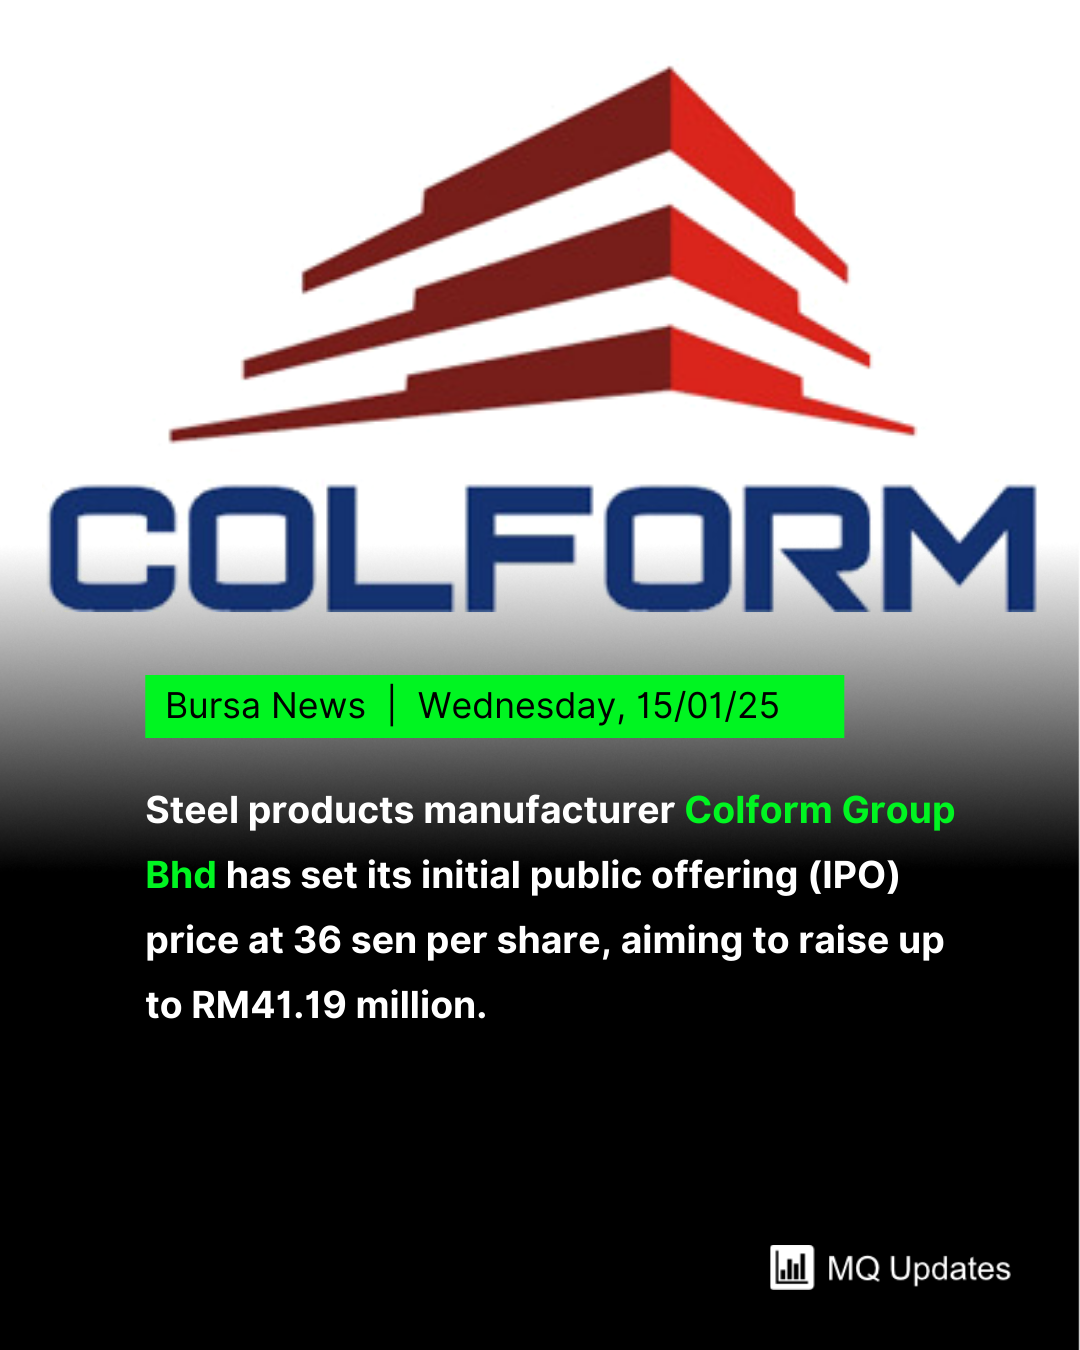
COLFORM GROUP BERHAD SASAR RM41.19 JUTA DARIPADA IPO PASARAN ACE

fireinabidin999 . 2025-01-15
COLFORM GROUP BERHAD TARGETS RM41.19 MILLION FROM ACE MARKET IPO
2025-01-13
Indices


Market Summary
Gainers
193
Losers
964
Unchanged
419
Untraded
799
Featured Posts
Introducing MY's First IPO Fund for Sophisticated Investors!
New Update. Discover investment communities that resonate with your ideas
M & A Value Partners IPO Equity Fund has been launched - Targeted 13% Return p.a
Latest Videos


Daily Stocks
Stock Name
Last
Change
Volume
Stock Name
Last
Change
Volume
Stock Name
Last
Change
Volume
MQ Trading Signals
Stock
Time
Signal
Duration
Stock
Time
Signal
Duration
Stock
Price Target
Price Call
Firm
Date
Stock
Type
Quarter
Stock
YoY Growth
Ann. Date
Stock
Dividend
Stock
Subject
Amount
TWL HOLDINGS BERHAD - REDEEMABLE CONVERTIBLE UNSECURED LOAN STOCKS 2023/2028
5.0000%
Ann. Date
Stock
Type
Stock
Name
Type
Stock
Name
Type
Ann. Date
Stock
Units
Search i3investor
Apps


Top Articles
1
2
Good Articles to Share
Eli Lilly CEO on Fighting Cancer and Obesity, Drug Pricing (Correct)
3
Good Articles to Share
Evercore ISI's Julian Emanuel says its too early to buy weakness
4
Good Articles to Share
5
Good Articles to Share
6
Good Articles to Share
7
Good Articles to Share
Thousands help at huge Los Angeles wildfire donation center | REUTERS
8
Good Articles to Share
Tens of thousands demonstrate in nationwide strike in Belgium | REUTERS
#
Stock
Score
Featured Advertisers
AmEquities (LYH)
Cash upfront (brokerage 0.05% flat), T+2 / T+7 account (3x cash, 2x share), Margin account (competitive interest)
TA Securities (DJS)
Cash collateral (1x cash, 1x share), T+2 / T+7 account (3x cash, 2x share), Margin account (flexible margin)
M+ Online Kulai Branch
Cash upfront (brokerage 0.05% - 0.08%), T+2 / T+7 account (2x cash, 1x share)
Featured Advertisers / Partners


Asia Analytica's Top Picks for 2024
Moving into 2024, we think two specific industries could do well, namely the construction and digita...
The Star's Stock Pick 2024
The Star's Stock Pick 2024
MPLUS 1Q24 Market Chat: Reboot, Realign and Revitalise
The US GDP continues to grow, while inflationary pressure has been cooling off throughout the year. ...
TA Research Top Picks for 2024
TA research shared a few key investment themes for 2024, which are the digital economy, domestic spe...
Maybank Investment Bank's Top Mid-Small Cap Buys for 2024
2024 should be a better year for Malaysia on several fronts. It will be a year of execution of the m...

Ride The Bull Short The Bear
CS Tan
4.9 / 5.0
This book is the result of the author's many years of experience and observation throughout his 26 years in the stockbroking industry. It was written for general public to learn to invest based on facts and not on fantasies or hearsay....
Regional Stocks - SG
Stock Name
Last
Change
Volume