


ATFX Market Analysis
Gold price traders need to get ready for a prolonged winter

Gold traders that were hoping for a boost in prices following President Biden's election have been unruly disappointed. Biden's plan to introduce spending of $1.9 trillion, a figure that amounts to 9.1% of US 2020 GDP, appears to have been priced into gold prices and did not deliver a much-needed boost to the yellow metal.
Last week, Janet Yellen, Biden's Treasury Secretary nominee, and famous for leading the Federal Reserve, said more spending was needed to combat the coronavirus pandemic. She also downplayed investors' concerns about debt levels. The US Federal Debt to GDP was at 104% before the pandemic and rose to 135% in Q2, 2020, and this gauge looks set to rise further in the months ahead.
All of this should ultimately boost gold prices. But for now, inflation expectations remain low, whilst US bond yields have risen sharply. This means that the real yield has risen in the USA, which tends to hurt gold prices.
The US ten-year government bond yield has increased from 0.49% in August 2020 to 1.08% on January 22, and from a technical point of view, it would not be surprising, if we could see the yield reach 1.31%.
Also, weighing heavy on gold prices is the sharp rise in stock markets. Few people would like to hold an asset like gold that does not pay a yield when they could buy a stock with dividend yield, or a share in a company set to benefits from the reopening of the economy following the pandemic.
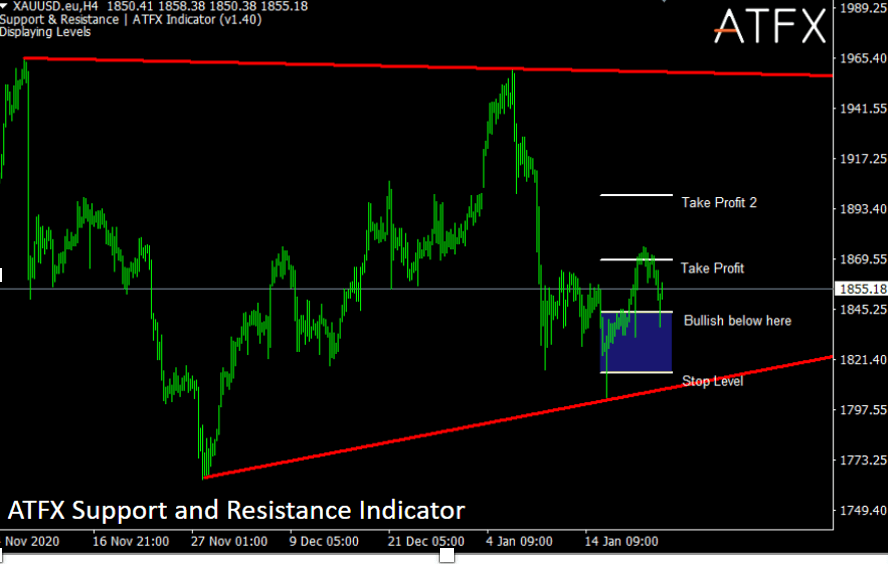
The conflicting signals are evident in the gold price action. Seen from a technical point of view, XAUUSD looks trapped in a triangle pattern. As seen in the chart below, we can draw a downward sloping trend line via the November and January highs. Whilst an upward-sloping trend line goes via the November and January lows. The endpoint of this triangle is July, and that is for how long gold prices could remain oscillating around $1867. However, realistically there will be a breakout or a morphing on this pattern within the next four to six weeks.
So what could be the next likely path for gold prices?
As long as the price trades above the January 11 low of $1815, XAUUSD will trade within the triangle pattern. The short-term trend will also be bullish per the ATFX Support and Resistance indicator, and the price might test the downward sloping trend line, currently around $1958.
If a push higher fails to materialize, a break to the January 11 low might send the November low price at $1756, and trigger a breakout from the triangle pattern.
Written by Alejandro Zambrano, ATFX Global Chief Market Strategist
Spread bets and CFDs are complex instruments and come with a high risk of losing money rapidly due to leverage. 74.07% of retail investor accounts lose money when trading CFDs / Spread betting with this provider. You should consider whether you understand how CFDs / Spread betting work and whether you can afford to take the high risk of losing your money.
ATFX is a co-brand shared by a group entities including:
- AT Global Markets (UK) Ltd is authorized and regulated by the Financial Conduct Authority (FCA) in the United Kingdom with registration number 760555. The Registered Office: 1st Floor, 32 Cornhill, London EC3V 3SG, United Kingdom.
- AT Global Markets LLC is a Limited Liability Company in Saint Vincent and the Grenadines with company number 333 LLC 2020. The Registered Office: 1st Floor, First St. Vincent Bank Bldg, James Street, Kingstown, St. Vincent and the Grenadines.
- ATFX Global Markets (CY) Ltd is authorized and regulated by the Cyprus Securities and Exchange Commission (CySEC) under the license no. 285/15. The Registered Office: 159 Leontiou A' Street, Maryvonne Building Office 204, 3022, Limassol, Cyprus.
- AT Global Markets Intl Ltd is authorized and regulated by the Financial Services Commission with license Number C118023331. The Registered Office: Suite 207, 2nd Floor, The Catalyst, Silicon Avenue, 40 Cybercity, 72201 Ebène, Republic of Mauritius.
More articles on ATFX Market Analysis
Could accelerating inflation and Job growth pressure the Fed's decision
Created by ATFX | Jul 28, 2021
Discussions
Be the first to like this. Showing 0 of 0 comments
Post a Comment
Featured Posts


Latest Videos

.png)


Apps


Top Articles
1
Stock Market Enthusiast
PBBANK: Technical Outlook Suggest Target of RM5 (Uptrend but Overbought) - KingKKK
2
Koon Yew Yin's Blog
5
Koon Yew Yin's Blog
6
save malaysia!
7
8
#
Stock
Score
Daily Stocks
Stock Name
Last
Change
Volume
Stock Name
Last
Change
Volume
Stock Name
Last
Change
Volume
MQ Trading Signals
Stock
Time
Signal
Duration
Stock
Time
Signal
Duration
Featured Advertisers / Partners


Ride The Bull Short The Bear
CS Tan
4.9 / 5.0
This book is the result of the author's many years of experience and observation throughout his 26 years in the stockbroking industry. It was written for general public to learn to invest based on facts and not on fantasies or hearsay....