


ATFX Market Analysis
Bitcoin cash might soon experience an explosive 22.5% move

With most cryptocurrencies creeping higher in the last few days, it looks like it is time for Bitcoin Cash, BCHUSD, to experience sharp burst of volatility.
Bitcoin Cash has been lagging behind Bitcoin (BTC) by significant proportions. The original coin was priced near $54500 at pixel time, and Bitcoin Cash was priced at $537. However, this is not stopping traders from trading Bitcoin Cash, as it is priced lower and offers a higher possible percentage return. Such as event might unfold over the next few days.
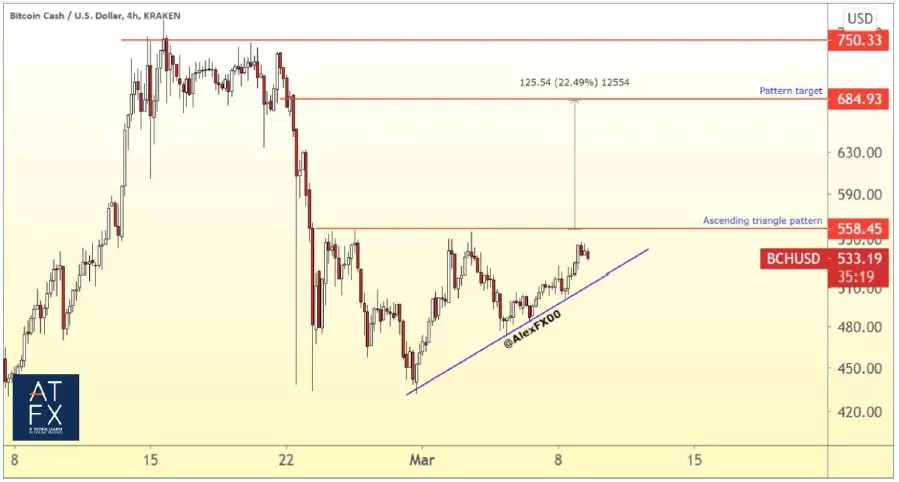
BCHUSD remains trapped in an ascending triangle pattern. The February 25 and March 3 highs of $558.45 form the horizontal part of the pattern, whilst we can connect the February low and March 5, 6 and 8 lows with an upward sloping trend line.
The difference between the horizontal level and the start of the upwards pointing trend line is approximately $125.54. The amount can be added to the lateral level of $558.45 to derive the pattern target of $684.93. The $125.54 move is equivalent to a 22.5% gain.
For the price to embark on this bullish path, the price would need to successfully break the level of $558.45, and afterwards not trade strongly back into the pattern. If the price indeed trades below $558.45 after a breakout, then the pattern would have failed.
What are your thoughts on BTHUSD? Interact with Alex via Twitter.
BCHUSD Four hour Chart
Written by Alejandro Zambrano, ATFX Global Chief Market Strategist
Spread bets and CFDs are complex instruments and come with a high risk of losing money rapidly due to leverage. 74.07% of retail investor accounts lose money when trading CFDs / Spread betting with this provider. You should consider whether you understand how CFDs / Spread betting work and whether you can afford to take the high risk of losing your money.
ATFX is a co-brand shared by a group entities including:
- AT Global Markets (UK) Ltd is authorized and regulated by the Financial Conduct Authority (FCA) in the United Kingdom with registration number 760555. The Registered Office: 1st Floor, 32 Cornhill, London EC3V 3SG, United Kingdom.
- AT Global Markets LLC is a Limited Liability Company in Saint Vincent and the Grenadines with company number 333 LLC 2020. The Registered Office: 1st Floor, First St. Vincent Bank Bldg, James Street, Kingstown, St. Vincent and the Grenadines.
- ATFX Global Markets (CY) Ltd is authorized and regulated by the Cyprus Securities and Exchange Commission (CySEC) under the license no. 285/15. The Registered Office: 159 Leontiou A' Street, Maryvonne Building Office 204, 3022, Limassol, Cyprus.
- AT Global Markets Intl Ltd is authorized and regulated by the Financial Services Commission with license Number C118023331. The Registered Office: Suite 207, 2nd Floor, The Catalyst, Silicon Avenue, 40 Cybercity, 72201 Ebène, Republic of Mauritius.
More articles on ATFX Market Analysis
Could accelerating inflation and Job growth pressure the Fed's decision
Created by ATFX | Jul 28, 2021
Discussions
Be the first to like this. Showing 0 of 0 comments
Post a Comment
Featured Posts


Latest Videos


Apps


Top Articles
1
BFM Podcast
2
CGS-CIMB Research
Genting Plantations - Proposed Land Acquisition in Indonesia
3
4
Koon Yew Yin's Blog
6
save malaysia!
8
THE INVESTMENT APPROACH OF CALVIN TAN
TSH RESOURCES (9059) VERSUS JOHOR PLANTATION GROUP (5323) Compare & Contrast, Calvin Tan
#
Stock
Score
Daily Stocks
Stock Name
Last
Change
Volume
Stock Name
Last
Change
Volume
Stock Name
Last
Change
Volume
MQ Trading Signals
Stock
Time
Signal
Duration
Stock
Time
Signal
Duration
Featured Advertisers / Partners


Ride The Bull Short The Bear
CS Tan
4.9 / 5.0
This book is the result of the author's many years of experience and observation throughout his 26 years in the stockbroking industry. It was written for general public to learn to invest based on facts and not on fantasies or hearsay....