HEIM reach resistance on daily chart - should you sell?
DividendGuy67
Publish date: Fri, 17 May 2024, 12:15 AM
I previously blogged about HEIM here.
On daily chart, HEIM closed at the key downtrend line resistance connecting 5 points - should you sell?

If you are a disciplined "swing" trader, you should follow your trading system i.e. you should. Majority odds that after hitting resistance, price will likely fall back down.
But what about the long term dividend investor like me? Should I sell?
Short answer is no.
When I bought HEIM, I did not buy to "swing trade" but to invest over the long term, because it is a superior business, run by decent management and was available at an attractive price. My dividend yield on cost is attractive, around 5.4% per annum and growing.
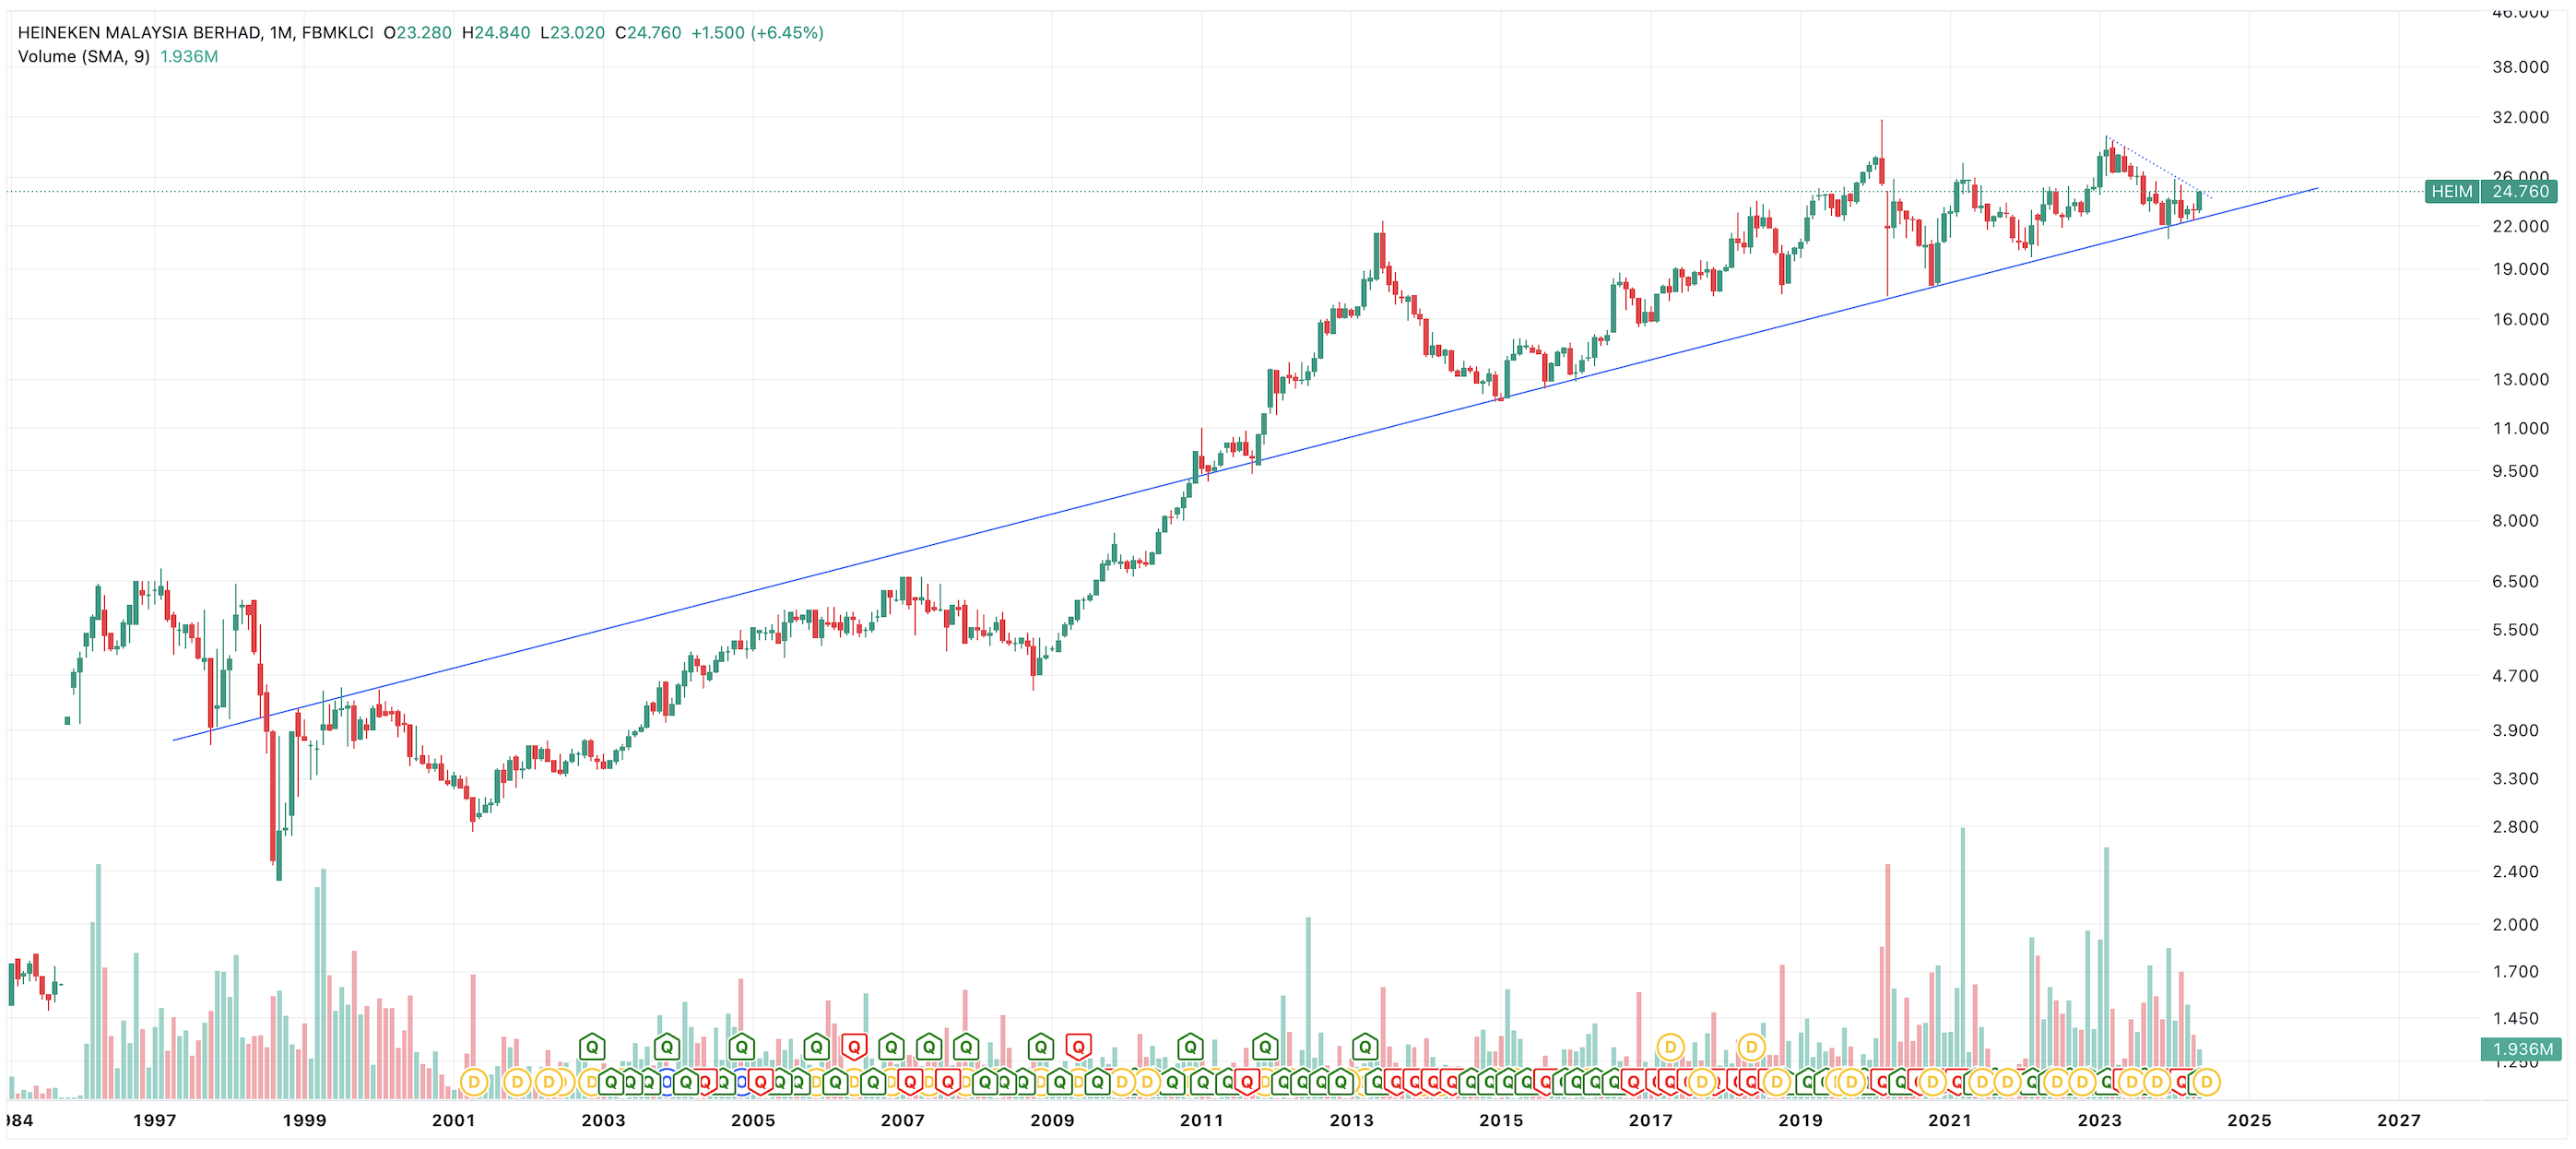
Secondly, investors should look at monthly candle charts spanning 2-3 decades like below.

A few key points:
1. The uptrend line above connected nearly 20 points spanning over 3 decades, so, this line is even stronger than the first downtrend line above.
2. Putting both charts together, the likely interpretation, is after hitting the short term resistance, if it dips, it will just be a matter of time, before it breaks out again to make new high i.e. if you sell, the risk is you may not successful get back in again and therefore, you could miss the bigger uptrend move.
3. Before this bull market is over, my minimum price target is RM32 i.e. much higher than RM24.76. My long term expectation is RM40 or higher.
4. Short term price gyrations should be ignored. You are getting paid 5.4% per annum dividends (and growing) which is already higher than FD. You are also sitting on price gains.
In short, ignore short term price gyrations from daily candle charts. Use it only to your advantage when accumulating near that uptrend line on dips. Otherwise, tune out the daily price gyrations. Take advantage of the manic depressive Mr Market!
Disclaimer: As usual, you are fully responsible for your own investments.
Related Stocks
| Chart | Stock Name | Last | Change | Volume |
|---|
More articles on https://dividendguy67.blogspot.com
Created by DividendGuy67 | Jan 24, 2025
Created by DividendGuy67 | Jan 22, 2025


