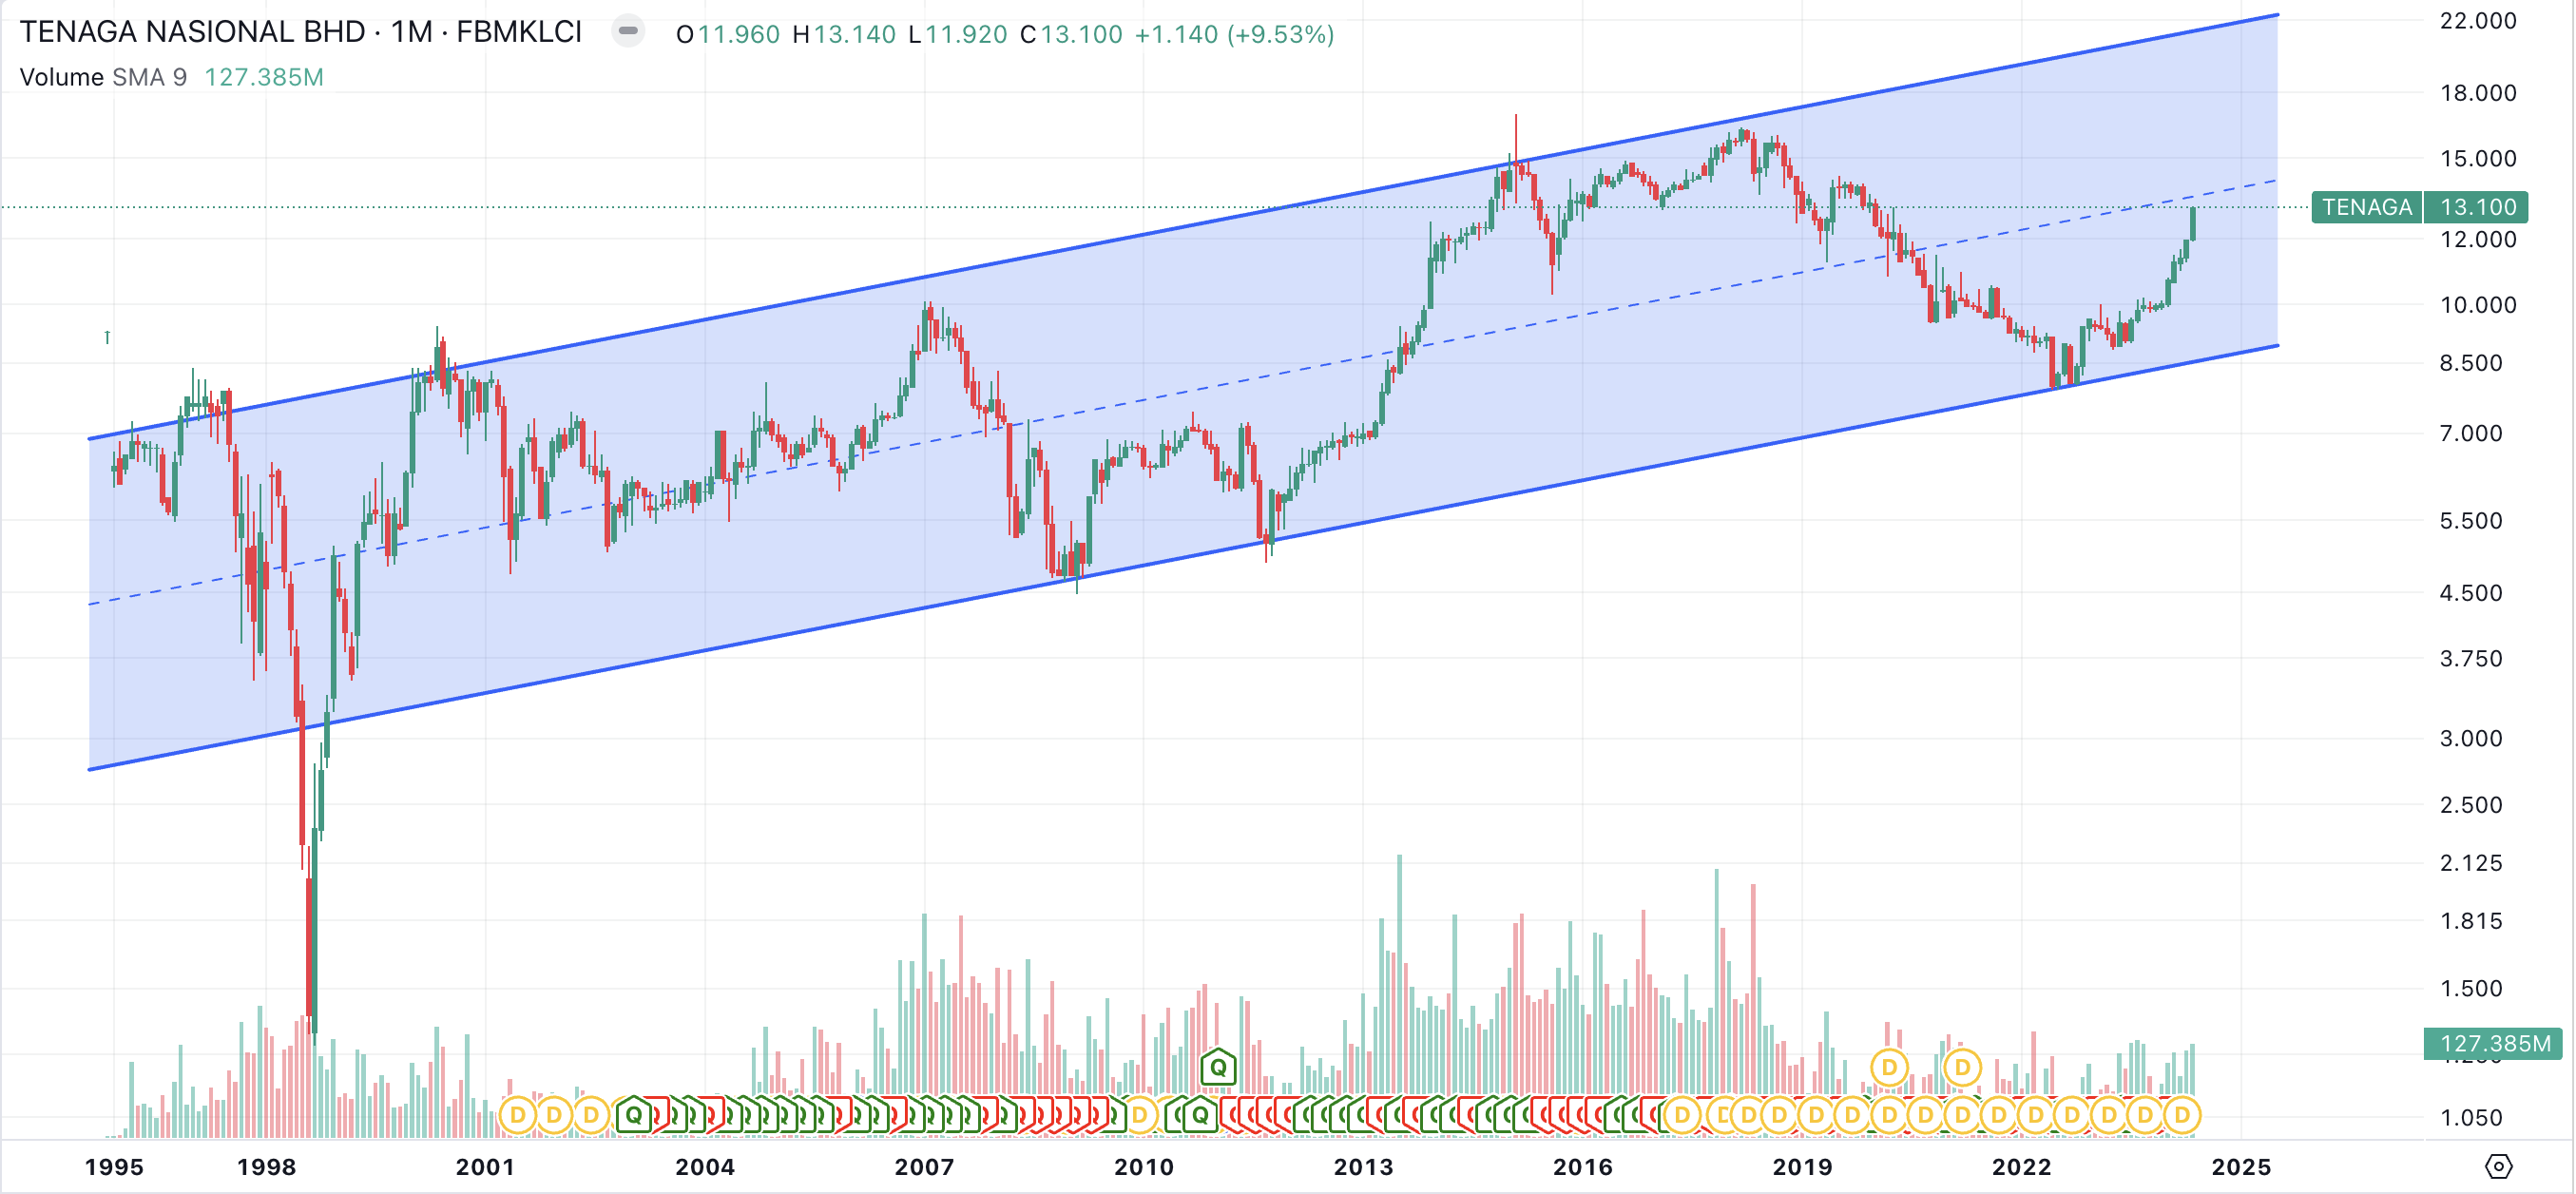
TENAGA - Is it time to sell?
DividendGuy67
Publish date: Fri, 24 May 2024, 01:37 AM
I previously blogged about TENAGA here and here.
TENAGA powers up to close at RM13.1 today. Is it time to sell?
As usual, for long term investors, we look at Monthly Charts over past 3 decades...

Key observations:
1. Nice to see a long term rising channel - it means, TENAGA is a fundamentally sound stock.
2. It's not even reached midpoint of that channel yet - why even think of selling?
3. With a rising channel, the longer you hold, the more likely it will make new highs.
4. I will only consider selling my long term positions if it reaches close to the top of that channel! Otherwise, it's just noises.
In a bull market, I am going to quote one of my favorite traders of all time - Jesse Livermore.
So, Jesse inspires me to keep holding. Keep sitting. Keep sitting tight!
And thanks to sitting tight after 3 years, TENAGA and other greens have offset the reds to power my portfolio to new all time highs again. Today is the 12th time this month alone, and the longest new all time high streak since I started monitoring. This is clearly a strong bull market for my portfolio, so, thank-you Mr Market!
Hope your portfolio also meets and exceeds your own investment objective!
Disclaimer: As usual, you are fully responsible for your own trading and investment decisions.
Related Stocks
| Chart | Stock Name | Last | Change | Volume |
|---|
Market Buzz
2025-01-22
TENAGA2025-01-21
TENAGA2025-01-21
TENAGA2025-01-21
TENAGA2025-01-21
TENAGA2025-01-21
TENAGA2025-01-21
TENAGA2025-01-21
TENAGA2025-01-21
TENAGA2025-01-20
TENAGA2025-01-20
TENAGA2025-01-20
TENAGA2025-01-20
TENAGA2025-01-20
TENAGA2025-01-20
TENAGA2025-01-17
TENAGA2025-01-17
TENAGA2025-01-17
TENAGA2025-01-17
TENAGA2025-01-17
TENAGA2025-01-17
TENAGA2025-01-17
TENAGA2025-01-16
TENAGA2025-01-16
TENAGA2025-01-16
TENAGA2025-01-16
TENAGA2025-01-16
TENAGA2025-01-16
TENAGA2025-01-15
TENAGA2025-01-15
TENAGA2025-01-15
TENAGA2025-01-15
TENAGA2025-01-15
TENAGA2025-01-15
TENAGA2025-01-14
TENAGA2025-01-14
TENAGA2025-01-14
TENAGA2025-01-14
TENAGA2025-01-13
TENAGA2025-01-13
TENAGA2025-01-13
TENAGA2025-01-13
TENAGAMore articles on https://dividendguy67.blogspot.com
Created by DividendGuy67 | Jan 22, 2025
Discussions
u are using non-adjusted chart, that why your chart like that
if u use adjusted chart, it is like Ytl, Ytlp. LOL!
2024-05-26 22:30
@speakup, I prefer log charts, instead of traditional linear charts, so that every doubling is equidistant.
I use price charts instead of adjusted with dividends, to measure the worth of a company at any point in time - meaning monies paid out is no longer part of the company's worth.
No right or wrong, just know your reasons and how you interpret.
2024-06-09 14:33


calvintaneng
Inside a Google Data Center
See
https://www.youtube.com/watch?v=XZmGGAbHqa0
See carefuly
At the Very "Center" of Data Center are HARD DISK DRIVES (HDD) Rows and Rows and Rows of HDD!!
JCY
NOTION
DUFU
BEST BUY NOW!
2024-05-25 00:20