


https://dividendguy67.blogspot.com
UMC - here's what I see

This is for personal future reference only.
1. I personally find it hard to read this chart, because of its short history - only 2 years, less reliable.
2. The stock was IPO'ed at 32 sen if not mistaken, so, original shareholders have doubled their monies.
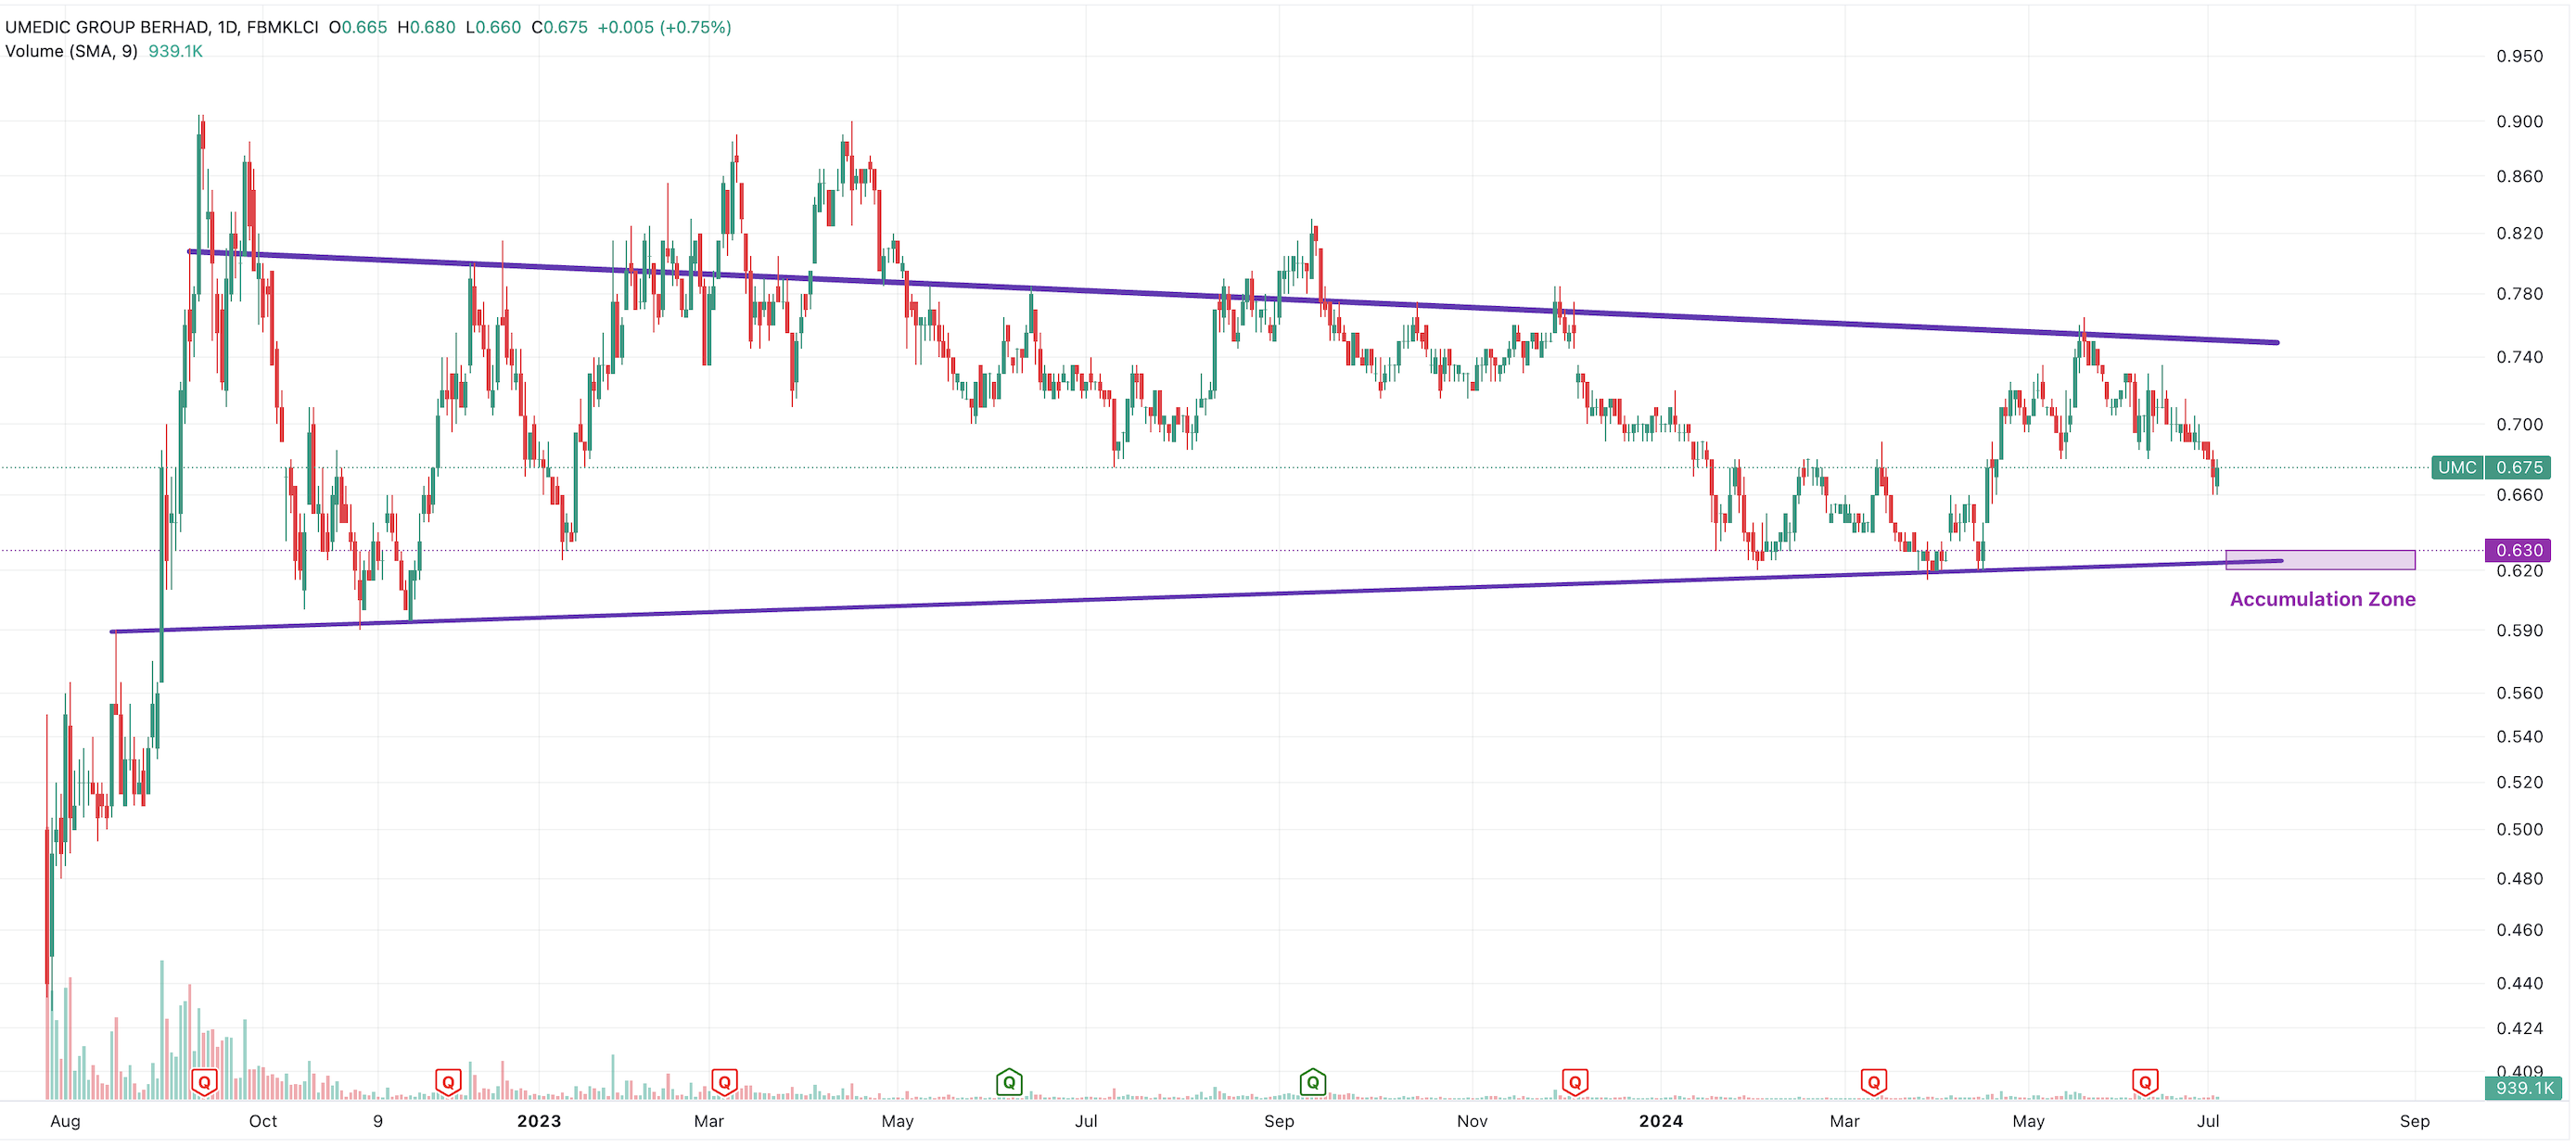
3. The 2 obvious lines I see is shown above.
- Am lukewarm about the Top line because it is "thicker" (meaning touches many more points, i.e. potentially stronger).
- Am a little concerned about the Bottom line because it is "thinner" (meaning it touches less points, i.e. potentially weaker than the top line).
- Ideally, I like my bottom and my top line sloping upwards over decades, and I like my bottom line to be "thicker".
4. I know this is a medical related stock and over the longer term, is supposed to have the brighter prospects than average. However, my gut tells me something isn't quite right yet. (Hence I usually pass this trade personally, not because it's below average trade idea, but because it haven't met my preferred standards yet).
5. However, if I must trade this stock (we are never forced to trade), you need to trade very well ("A" or "B" grade trading), to offset the disadvantages of the chart set-up (C rated). To trade well, you need to go with the attitude that the Universe decides if you were meant to receive this profit or loss. This mean - "don't chase". Stalk and wait very patiently at the bottom of that thin line.
6. And if you successfully got hit with the Buy Order, just queue a GTC sell order for some/all of your position near the top of that thicker line, or slightly lower to maximize the odds of being filled at a profit - the size of the profit doesn't matter too much. In situations like this, don't be greedy. Better to cycle the profitable sale funds for other higher rated opportunities.
7. Position size small, due to the 4 chart risks (Rating = C): (a) Short chart (only 2 years, less reliable, riskier). (b) Thicker line not rising (means lower profit potential in the short term, but in the long term, could be setting up a potential breakout, but not yet). (c) Thinner lower line (means if there's bad news, then, the path of lesser resistance is down). (d) both lines not sloping upwards significantly.
8. EPS declining YoY for Q1, Q2 and Q3. (Rating = C-). This is not an uncommon pattern for newly listed companies where the euphoria is in the first year (to "pad" good results to shoot price up) and 2nd year is when reality hits. This company needs to show a turnaround within the next 1-5 quarters I guess, because if EPS keeps declining YoY, then, that high PE multiples can contract fast one day to go back to 32 sen IPO level. That's the risk. However, these types of setups can one day morphed into high probability setup later depending on how it develops, so, one day, the reward will appear as I expect this stock to be potentially volatile if its earnings are not steady. E.g. surprise positive earnings. However, surprise by definition is lower odds, so, if you aim to have 85%-90% win rate, then, better to reduce the gambling element. Don't bet on surprises. Follow Warren Buffet who demands "virtual certainty" that he will win.

9. Personally, I am bullish on medical sector long term prospects. If anyone has other medical stock ideas to compare, feel free to drop the ideas in the comments below. I might not check every day, but if I think it's interesting to look at it, I will take a look.
Disclaimer: As usual, you are fully responsible for your own trading/investing decisions.
More articles on https://dividendguy67.blogspot.com
Discussions
Be the first to like this. Showing 1 of 1 comments
Post a Comment
Featured Posts


Latest Videos


Apps


Top Articles
1
HLBank Research Highlights
2
Mercury Securities Research
3
PublicInvest Research
4
RHB Investment Research Reports
Market Strategy - Data Centre-Artificial Intelligence Party Pooper
5
MQ Market Updates
6
HLBank Research Highlights
7
Kenanga Research & Investment
Renewable Energy - Big News, Another 2GW LSS Incoming (OVERWEIGHT)
8
Mercury Securities Research
#
Stock
Score
Daily Stocks
Stock Name
Last
Change
Volume
Stock Name
Last
Change
Volume
Stock Name
Last
Change
Volume
MQ Trading Signals
Stock
Time
Signal
Duration
Stock
Time
Signal
Duration
Featured Advertisers / Partners


Ride The Bull Short The Bear
CS Tan
4.9 / 5.0
This book is the result of the author's many years of experience and observation throughout his 26 years in the stockbroking industry. It was written for general public to learn to invest based on facts and not on fantasies or hearsay....
DividendGuy67
25 days after this article is written, my queue to buy at 0.630 was filled. I queued this order just after I published the article. Today's low is 0.625.
This trade is just for reference.
The amount is small, less than 1% capital.
Let's see how this trade pans out.
If others have followed this recommendation, please feel free to share here.
2024-07-29 19:10