


https://dividendguy67.blogspot.com
MAYBANK - How high will it go?

MAYBANK is my largest holdings and I previously blogged about it here.
Why the topic question - how high will it go?
Across sites, I see the occasional highly optimistic predictions for MAYBANK upcoming price, here included.
If you are inexperienced, it's easy to get swept away by these highly optimistic predictions. It is important for the intelligent investor/trader to remain grounded and stay rational at all times. Over the past 3 decades, I learnt from the school of hard knocks, that my best results come when I am rational and realistic, and my worst results come from feelings of euphoria and fear. To quote from Benjamin Graham, the legendary author of the Intelligent Investor:
"Investing is most intelligent when it is most businesslike".
"The intelligent investor is a realist (rational investor) who sells to optimists and buys from pessimists"
So, how high will it go?
As usual, I will turn to my 3 decade Price Chart. I will number my views on this single chart below transparently for easy review.
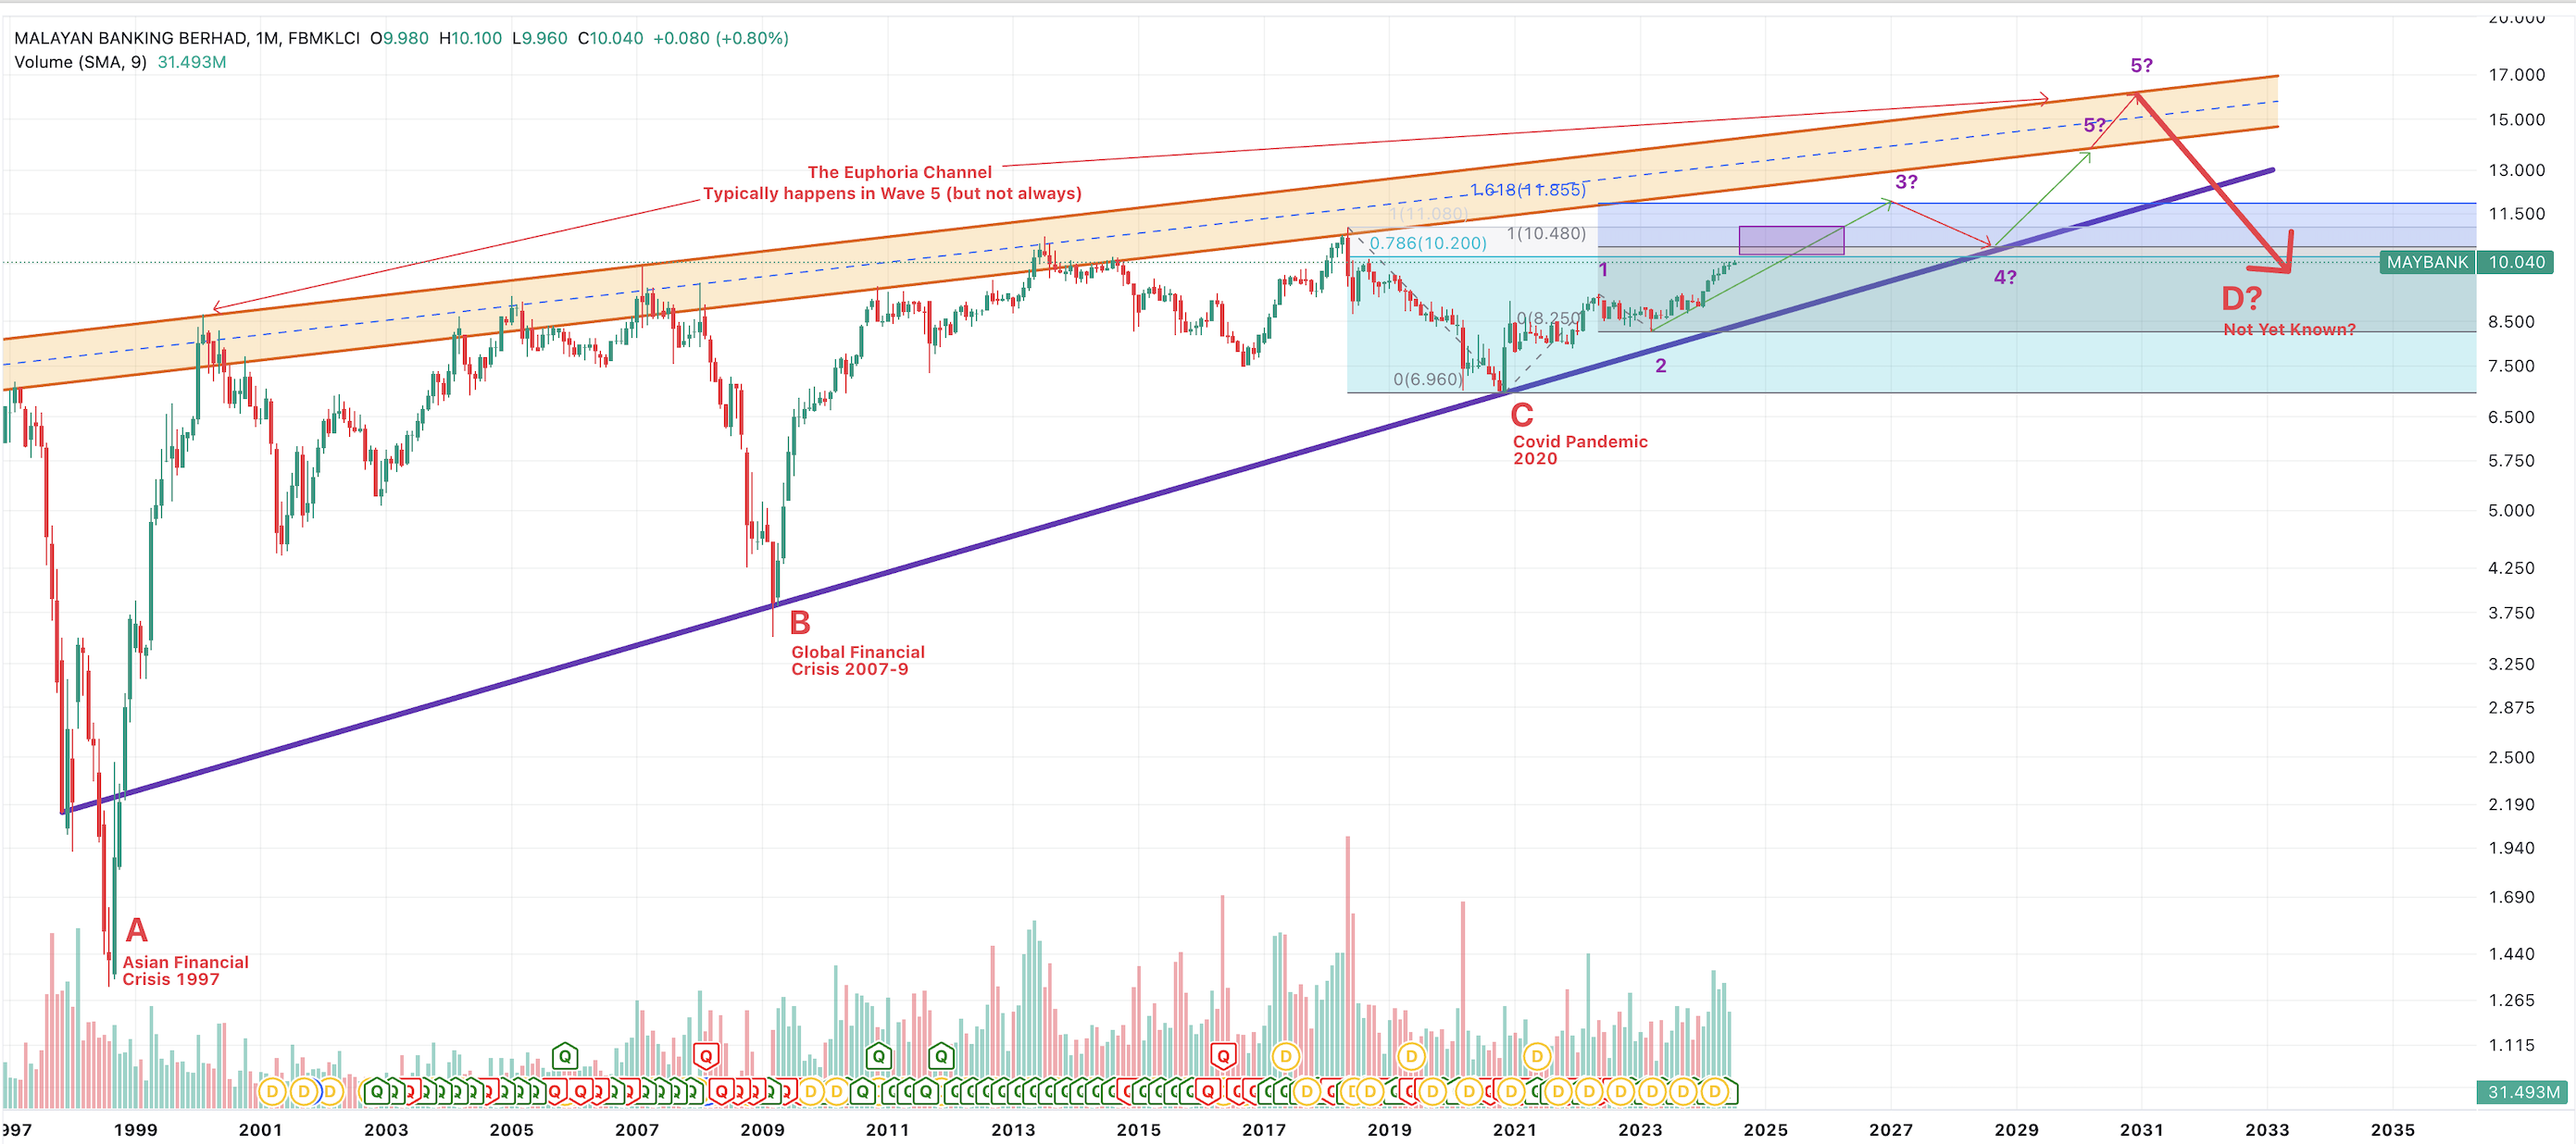
View #1 - MAYBANK long term support line and resistance line are sloping upwards, and appears to be converge - the meeting point may be a couple of decades away.
View #2 - MAYBANK price will crash eventually. They always do. Here, it appears every 10-12 years or so.
A = Asian Financial Crisis - I was there when it happened and the fear was unbelievable. In many parts of SEA, there were riots, people were throwing away their cars, their houses, news sensationally reporting people killing each other. Banks feared to be bankrupt, etc. Times like these, support lines will always be broken due to rampant fear that even Technical Analysis has limitations. (so you see that breach below the purple line, due to the greatest fears then).
B = Global Financial Crisis 2007-9 - The fear is also massive in US that eventually spread across the world, but in Malaysia, the fear is not as big as when Asian Financial Crisis happened because Malaysia was in the heart of 1997 but not 2007-9. So, a smaller breach below that thick purple line.
C = COVID pandemic low of 2020. The fear is high, but clearly, not as high as A or B. The thick support line held.
D = My expectation that one day, price will crash. I don't know the reason. Here, I've drawn some zig zag lines showing my wild guess that it might be 2031-2033 (nobody knows, I'm not Nostradamus, so, take this with a HUGE grain of salt).
View #3 - With Views #1 and #2 combined, you will get a rough idea on where MAYBANK peak price will be and roughly by when.
Other minor views
I call these "checkpoints". Technical analysis is always probabilistic with many multiple outcome scenarios, each with varying odds. So, the discipline requires me to set the "null hypothesis" first (my guess of the most likely outcome). I try to break the macro down to the next level down, in order to set the checkpoint. When the checkpoint turns out to be true, I continue to the next step. When the checkpoint breaks down, I adjust to the next highest odds scenario, whilst still recognizing the macro view. Never lose sight of the macro view (the big picture). I will also share some comments using Elliott Wave terminology - I will differentiate the waves into Major, Minor and Minute.
Minor view #4 - MAYBANK is currently in Major Impulse Wave Up and Minor Impulse Wave 3 up from Covid Pandemic low. If this view is true, your best thing to do is sit tight and do nothing, because price will zig up and zag down, but the outcome from this view is to see higher highs and higher lows i.e. in a bull market, you do nothing but sit tight.
Minor view #5 - in the minor Wave 3 up, price still zigs and zags. And I see the important resistance zone coming up marked by the Purple box which I expect to be the minor Wave 4 down. This may last for a while, because typically, Wave 4 is the most unpredictable. Wave 4 tends to shake the weak investors hands, making them think that the major correction will come, but often, it fools them and is actually an opportunity for underweighted investors to top up. I expect supports will hold, price then resumes to minor Wave 5 to finish major Wave 3 near the 1.618 Fibonacci Extension, a typical target for Wave 3. So, the purple box is an opportunity to buy more MAYBANK and rebalance MAYBANK if my other stocks outperformed MAYBANK to cause MAYBANK mix to fall below benchmark.
Minor view #6 - note that the top of the Major Wave 3 is typically 1.618 Fibonacci extension (but not always) and this is around 11.86 (near RM12). Typically, this resistance as strong, and if so, it will then cause price to enter the major Corrective Wave 4, which will spook investors out as it approaches the thick support line (but if the line is not drawn and if you do not see, you will feel very fearful because it drops from RM12 down to approaching RM10). However, I still expect that thick purple support line plus the RM10 round number resistance to hold by then, and if so, years later, this becomes the second opportunity to accumulate. In short, over the next several years, I expect to get at least 2 more major buying opportunities from now up to 2028 - the purple box and the fall to the thick bottom support trend line up.
Minor view #7 - after completing the minor Corrective Wave 4, we will then enter into the best, euphoric, happiest phase of all which is major Wave 5. Wave 5, towards the end of its phase, tend to rise in an exponential manner. At the end of that happy exponential Wave 5, the foreign investors holding of MAYBANK should be near maxed (or the intelligent ones exiting), everyone from Grab drivers, your family members, friends bought MAYBANK and all are feeling extremely euphoric, nothing like now, and maybe similar to the peak in 2007. This is when I expect price to break and enter into the "euphoric channel" shown. The more it breaks above, the more euphoric market becomes. It is around this time, when you want to follow Graham and sell to the Optimists. Because upon completion of this euphoric phase, we then enter into that most fearful Market Crash, marked by the final thick red arrow down that will break down towards 10 or below. Here, 50% crash from the peak is not impossible.
I hope you've enjoyed this bed-time story!
What are the lessons of this Nostradamus-like prediction up to 2033?
Lesson #1 - Nobody knows the future. This bed-time story is for fun only. I enjoy writing stories. And I'm no Nostradamus!
Lesson #2 - Price always zig-zag. They never travel in a straight line up. They go up, they go down, sometimes, they go up and fall down more/less. They are mostly unpredictable. This is reality.
Lesson #3 - But sometimes they have patterns. The best pattern are the highest probability ones.
Lesson #4 - Listen to the wisest of investors which are Buffett, Graham and the likes. Investing is most intelligent when it is most business-like. When MAYBANK one day becomes euphoric and the valuations become ridiculous, that's when you want to sell to the Optimists.
Lesson #5 - If you believe in the strength of the uptrend resistance channel drawn, you will see that the Target is always Dynamic and the Target is expected to increase with time in the case of MAYBANK. So, there's no fixed number target for MAYBANK. This is reality. Market is dynamic, not static. Unfortunately, Every IB analysts Target Price is always proven wrong over time. Unfortunately, this is reality.
Lesson #6 - If you believe that markets will eventually crash then, you probably want to sell once price is near/entered into that uptrend resistance channel drawn. My best case view today (50/50 chance, dynamic), is that before 2031-2033, MAYBANK should not exceed RM15-RM17, because it is a very high dividend payor paying nearly 6% dividend yield. It should exceed only towards the end of the Major Wave 5 which occurs very rarely (say once every decade plus/minus a few occasions). My base case expectation is 99% chance it won't get to RM15 before end 2026 (i.e. over next 2.5 years) from the line drawn in the chart - occasionally, some stocks have surprised me in the past, but not stocks like MAYBANK which is a blue chip, huge market cap, high dividend yield stock. The surprise tend to happen in Wave 4 (most unpredictable) and Wave 5 (euphoric) and I believe we are still in Wave 3.
In short, MAYBANK is not a good trading stock. (for better trading stocks, see my other posts where the IRR runs into 30%, 40% or higher).
Due to its nature, It is a long term dividend buy and hold stock for a long time (hopefully for a decade or so), before I finally sell to the Optimists!
Disclaimer: As usual, you are always full responsible for your trading and investing decisions.
Related Stocks
| Chart | Stock Name | Last | Change | Volume |
|---|
Market Buzz
2025-01-28
MAYBANK2025-01-28
MAYBANK2025-01-28
MAYBANK2025-01-27
MAYBANK2025-01-27
MAYBANK2025-01-27
MAYBANK2025-01-27
MAYBANK2025-01-24
MAYBANK2025-01-24
MAYBANK2025-01-24
MAYBANK2025-01-23
MAYBANK2025-01-23
MAYBANK2025-01-23
MAYBANK2025-01-22
MAYBANK2025-01-20
MAYBANK2025-01-20
MAYBANKMore articles on https://dividendguy67.blogspot.com
IBIT Positions as at 24 Jan 2025 - Paper Gains $8,680 in a month!
Created by DividendGuy67 | Jan 25, 2025
How I created US$4,855 "dividend" income in less than 30 minutes
Created by DividendGuy67 | Jan 24, 2025
Happy January! Trump inaugurated, account new all time highs
Created by DividendGuy67 | Jan 22, 2025
Featured Posts


Latest Videos


MQ Trading Signals
Time
Signal
Duration
Type
2025-01-28 14:50:00
ADX
10 Mins
SELL
2025-01-28 14:40:00
ADX
10 Mins
BUY
2025-01-28 12:20:00
ADX
10 Mins
SELL
2025-01-28 12:15:00
EMA 5
5 Mins
SELL
2025-01-28 12:10:00
EMA 5
5 Mins
BUY
Apps


Top Articles
1
Dragon Leong blog
2
CEO Morning Brief
No Lucky Escape for Bursa AI Proxies From DeepSeek-triggered Selldown
3
THE INVESTMENT APPROACH OF CALVIN TAN
4
CEO Morning Brief
NationGate Hits Three-month Low as Investors Weigh China’s AI Push
5
HLBank Research Highlights
6
M+ Online Research Articles
7
THE INVESTMENT APPROACH OF CALVIN TAN
AFTER ALL THE ACCUSATIONS & ALLEGATIONS CALVIN TAN WANT TO POST THE TRUTH IN DEFENSE, Calvin Tan
8
MQ Market Updates
#
Stock
Score
Daily Stocks
Stock Name
Last
Change
Volume
Stock Name
Last
Change
Volume
Stock Name
Last
Change
Volume
Featured Advertisers / Partners


Ride The Bull Short The Bear
CS Tan
4.9 / 5.0
This book is the result of the author's many years of experience and observation throughout his 26 years in the stockbroking industry. It was written for general public to learn to invest based on facts and not on fantasies or hearsay....
Value Investor Coo1eo
RM30 by 2030.
2024-07-07 13:59