


KLCI waves
KLCI waves 11

hotstock1975
Publish date: Sun, 14 Jun 2020, 10:52 PM
hotstock1975
0 101
Elliot wave analysis to measure price behavior for projecting next price actions
Weekly Time Frame
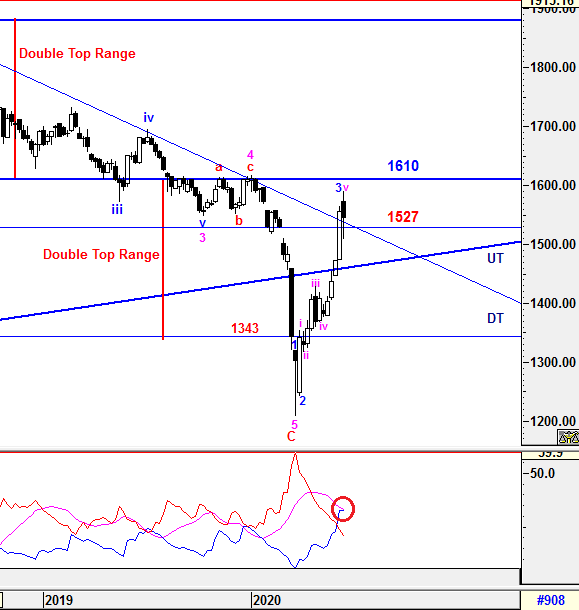
After a strong closed last week, a weekly closed with an alike hanging man candle formation indicates trend was halted and it is about to change. Besides that, the gap resistance was not able to be filled successfully and closed below lower gap which indicated selling pressure is still maintaining strong. A trend reversal would be more concrete if the selling momentum continue with a weekly closed below 1546.02 on this coming Friday and the down trend line (DT) will be the critical support at 1527 to initiate the continuous downtrend.
Nevertheless, sub 5th wave extension (v) of higher degree of 3rd wave extension (3) was end at the high of 1590.83 and incoming correction waves are expected which will be elaborated further at daily time frame.
After -DMI (red line) & +DMI (blue line) had criss-crossed each other, an knee jerk reaction was emerged as expected and +DMI had flatten indicated bullish trend has been halted. ADX (pink line) still heading down which implying that decreasing volatility for the current bullish momentum to halt making new high. Unless +DMI can make a golden cross above ADX lines to initiate another new momentum for KLCI to achieve higher level. Otherwise, it would hover around before a new trend to be taken placed.
Prevailing trend could be emerged if levels listed below was broken:
Resistance - 1610
Support - 1527 (DT line)
Daily Time Frame
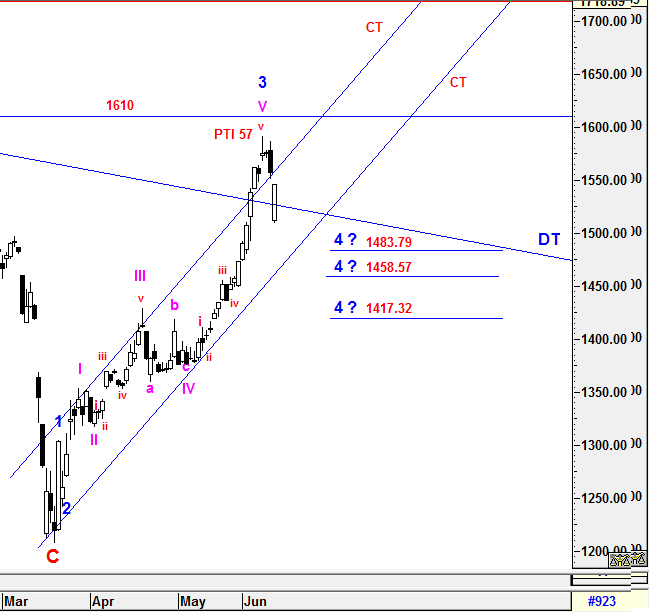
As the sub 5th wave extension(V)/Higher degree of 3rd wave extension (3) were ended at 1590.83, an throw over action from upper CT line had immediate led to an reversal back down under the CT range with 2 bearish candle formations such as shooting star and followed by bearish engulfing.
In this case, an higher degree of 4th wave (4) correction are expecting in coming days and could be ended at 3 possible projection levels of 1483.79, 1458.57 and 1417.32 which quantified from Fibo respective prior wave's level. The current PTI reading is showing positive indication that the coming magnitude correcton would be healthy enough to succeed the next higher degree of 5th wave after higher degree of 4th wave (4) end.
The structure of the entire correction waves would consist of ABC waves or complex waves if it take longer duration to complete. Anyway, Wave A may still be underway or ending soon before Wave B emerge.
Since KLCI was able to make a bounce from Fibo 38.2% of sub 5th wave extension(V) and closed above DT line, the entire correction waves would be monitored closely to anticipate any complex wave structure being formed in coming days.
Prevailing trend could be emerged if levels listed below was broken:
Immediate resistance - 1561, 1610
Immediate support - 1527 (DT line)
All waves' count and projected target are generated based on past/current price level and it might subject to be vary if degree of momentum movement has changed.
As we all aware that, any selling pressure will be cushion by the absent of short selling mechanism, the correction phase would not be severe until the mechanism is being introduced again in July. These is the day we should be extremely caution whereby Mr Market will move in efficient again.
Trade safely
Wave Believer
All waves' count and projected target are generated based on past/current price level and it might subject to be vary if degree of momentum movement has changed.
More articles on KLCI waves
KLCI waves 94 - WILL THE DOWNWARD PRESSURE TO BE IMPULSIVE TOWARDS WAVE E?
Created by hotstock1975 | Jan 24, 2022
KLCI waves 93 - EXTENSION UPWARD ENDED AND IT'S TIME TO THE DOWNSIDE?
Created by hotstock1975 | Jan 17, 2022
KLCI waves 89 - KLCI WILL EXTEND AND HIT LOWER TARGETS GRADUALLY
Created by hotstock1975 | Dec 20, 2021
Discussions
Be the first to like this. Showing 0 of 0 comments
Post a Comment
Featured Posts


Latest Videos


Apps


Top Articles
1
2
3
Koon Yew Yin's Blog
4
THE INVESTMENT APPROACH OF CALVIN TAN
5
save malaysia!
7
8
CEO Morning Brief
#
Stock
Score
Daily Stocks
Stock Name
Last
Change
Volume
Stock Name
Last
Change
Volume
MQ Trading Signals
Stock
Time
Signal
Duration
Stock
Time
Signal
Duration
Featured Advertisers / Partners


Ride The Bull Short The Bear
CS Tan
4.9 / 5.0
This book is the result of the author's many years of experience and observation throughout his 26 years in the stockbroking industry. It was written for general public to learn to invest based on facts and not on fantasies or hearsay....