


KLCI waves
KLCI waves 14 - 5th waves has started

hotstock1975
Publish date: Sat, 04 Jul 2020, 11:49 PM
hotstock1975
0 101
Elliot wave analysis to measure price behavior for projecting next price actions
Weekly Time Frame
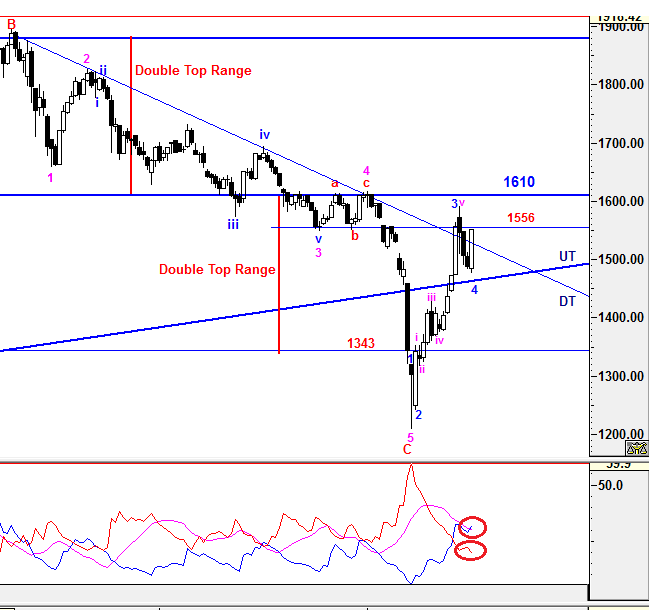
After narrowed selling pressure from prior week, KLCI was able to break above DT line again at 1527 with higher volume marginally and closed at 1552.65. To recap, the gap resistance in between 1556 - 1568 was failed to be filled with an false break on prior session and it is expecting to retest again whether the gap would be filled convincingly in coming days or weeks. Once gap is filled successfully, the next major resistance would be 1610 in order to achieve higher level shiftly as the prior Double Top Range effect would be written off convincingly.
As expected, the correction waves has been completed with complex formation ABC-WXY which will be elaborated further in daily time frame.
-DMI (red line) curved down and made new low indicates bearish sentiment is continuing decrease and +DMI (blue line) curved up with breaking above ADX (pink line) indicates the magnitude of bullish strenght is getting strong again. Besides that, ADX (pink line) is still heading down with smaller margin which implying the volatility of the current bull trend is marginally returned. Even though all this positive indication shows new trend has been taken placed on bull side, these 3 lines could still hovering around before ADX starting to curve up for stronger trend confirmation.
Prevailing trend could be emerged if levels listed below was broken:
Resistance - 1568, 1610
Immediate Resistance - 1556
Immediate Support - 1528 (DT line)
Daily Time Frame
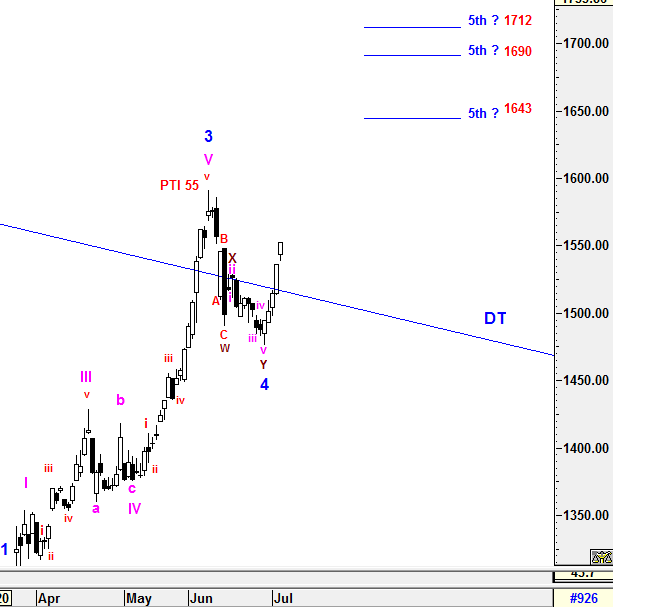
After it broke and traded below lower CT line for two days, it went further down to 1476.28 and bounced up to close with an Bullish Engulfing formation. These bullish candle formation has brought some strenght to penetrated CT and DT line with a greater magnitude.
Due to the bullish candle formation trend initiated and minimum criteria of Wave C met without reaching to the next lower projection target, it is concluded that an complex correction wave form has fulfilled and completed the entire of higher degree of 4th wave correction at 1476.28. The complex wave is revised as ABC-WXY formations instead of regular Zig Zag formation (5-3-5) because X wave was an failed wave. Moreover, these are combination waves effect which can be seen in smaller time frame.
Since the higher degree of 4th wave correction was completed with complex wave construction, higher degree of 5th wave up has started and underway. The current PTI reading (55) is still showing positive indication that the prior correcton was healthy enough to succeed the higher degree of 5th wave with 3 potential projected target at 1643, 1690 or 1712.
All waves' count and projected target are generated based on past/current price level and it may be subjected to vary if degree of momentum movement has changed.
Prevailing trend could be emerged if levels listed below was broken:
3rd resistance - 1610
2nd resistance - 1568, 1575
Immediate resistance - 1556
Immediate support - 1536
2nd support - 1528 (DT line)
Let's Mr Market pave the waves.
Trade safely
Wave Believer
More articles on KLCI waves
KLCI waves 94 - WILL THE DOWNWARD PRESSURE TO BE IMPULSIVE TOWARDS WAVE E?
Created by hotstock1975 | Jan 24, 2022
KLCI waves 93 - EXTENSION UPWARD ENDED AND IT'S TIME TO THE DOWNSIDE?
Created by hotstock1975 | Jan 17, 2022
KLCI waves 89 - KLCI WILL EXTEND AND HIT LOWER TARGETS GRADUALLY
Created by hotstock1975 | Dec 20, 2021
Featured Posts
Introducing MY's First IPO Fund for Sophisticated Investors!
New Update. Discover investment communities that resonate with your ideas
M & A Value Partners IPO Equity Fund has been launched - Targeted 13% Return p.a
Latest Videos


Apps


Top Articles
1
Axcapital's investment blog
KAB - Executing its way to a record quarter. Could more Petronas contracts be coming?
3
4
Koon Yew Yin's Blog
6
BFM Podcast
7
Koon Yew Yin's Blog
CPO price is rising rapidly as shown by chart below - Koon Yew Yin
8
#
Stock
Score
Daily Stocks
Stock Name
Last
Change
Volume
Stock Name
Last
Change
Volume
Stock Name
Last
Change
Volume
MQ Trading Signals
Stock
Time
Signal
Duration
Stock
Time
Signal
Duration
Featured Advertisers / Partners


Ride The Bull Short The Bear
CS Tan
4.9 / 5.0
This book is the result of the author's many years of experience and observation throughout his 26 years in the stockbroking industry. It was written for general public to learn to invest based on facts and not on fantasies or hearsay....