


KLCI waves
KLCI waves 20 - wave A emerged

hotstock1975
Publish date: Mon, 17 Aug 2020, 01:24 AM
hotstock1975
0 101
Elliot wave analysis to measure price behavior for projecting next price actions
Weekly Time Frame
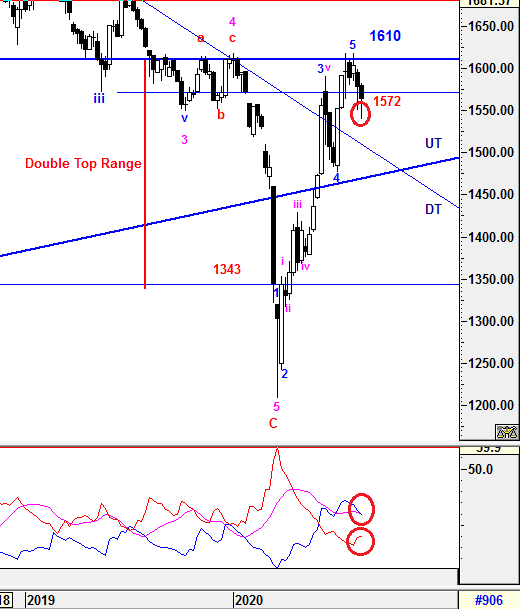
No doubt that KLCI was not able to close above 1572 as weakening strenght embeded from prior weeks. However, an wishful rebound may be emerged because of minor bottom fishing attempts.
On the other hand, the higher degree of correction will be elaborated further in daily time frame.
-DMI (red line) is starting to flatten indicates bearish momentum is decreasing. +DMI (blue line) is still heading down with narrow margin and crossed below ADX (pink link) indicates the pace of bull strenght is still decreasing. ADX (pink line) is curving down which implying the volatility of the current bull trend is still decreasing. Therefore, the summations of the 3 signals above is implying uncertainty still remains and knee jerk reaction is unavoidable as expected.
Prevailing trend could be emerged if levels listed below was broken:
Resistance - 1610
Immediate Resistance - 1572
Immediate Support - 1553
Daily Time Frame
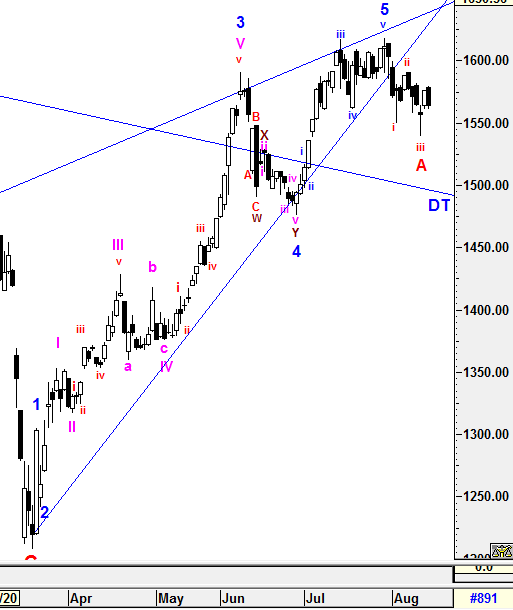
After 1566 was breached, wave A had been formed with 3 sub minutte waves eventhough wave A ended at 1539.61 which was 9 points away from its minimum criteria at 1530.
Currently, wave B is still being constructed with a possible target of 1569 - 1588.
On the other hand, the type of the entire correction formation will be monitored and reveal when wave C emerged as wave C has the most properties of wave forms which may lead to complexity formations.
All waves' count and projected target are generated based on past/current price level and it may be subjected to vary if degree of momentum movement change.
Prevailing trend could be emerged if levels listed below was broken:
Resistance - 1610
Immediate resistance - 1572, 1576
Immediate support - 1556
Support - 1536
Let's Mr Market pave the waves.
Trade safely
Wave Believer
More articles on KLCI waves
KLCI waves 94 - WILL THE DOWNWARD PRESSURE TO BE IMPULSIVE TOWARDS WAVE E?
Created by hotstock1975 | Jan 24, 2022
KLCI waves 93 - EXTENSION UPWARD ENDED AND IT'S TIME TO THE DOWNSIDE?
Created by hotstock1975 | Jan 17, 2022
KLCI waves 89 - KLCI WILL EXTEND AND HIT LOWER TARGETS GRADUALLY
Created by hotstock1975 | Dec 20, 2021
Discussions
Be the first to like this. Showing 0 of 0 comments
Post a Comment
Featured Posts


Latest Videos


Apps


Top Articles
1
The Alpha Trader
3
CEO Morning Brief
PGF Capital to Distribute Thermal Insulated Panels for Data Centres
4
南洋行家论股
5
Bimb Research Highlights
8
BFM Podcast
#
Stock
Score
Daily Stocks
Stock Name
Last
Change
Volume
Stock Name
Last
Change
Volume
Stock Name
Last
Change
Volume
MQ Trading Signals
Stock
Time
Signal
Duration
Stock
Time
Signal
Duration
Featured Advertisers / Partners


Ride The Bull Short The Bear
CS Tan
4.9 / 5.0
This book is the result of the author's many years of experience and observation throughout his 26 years in the stockbroking industry. It was written for general public to learn to invest based on facts and not on fantasies or hearsay....