


KLCI waves
KLCI waves 28 - Is Wave 3 started ?

hotstock1975
Publish date: Sun, 11 Oct 2020, 01:42 AM
hotstock1975
0 101
Elliot wave analysis to measure price behavior for projecting next price actions
Weekly Time Frame
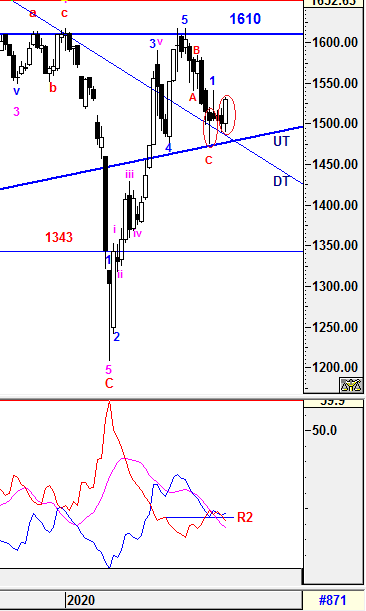
Finally, KLCI was able to close above 1515 convincingly after consolidated narrowly above both critical support of DT and UT line for weeks. These had realized the bullish signal of Hammer (created on 9/11/20) or Bullish Engulfing (combination of the hammer and the current white candle). Therefore, it increased the tendency of trend reversal to the upside.
On other hand, the Higher Degree of Wave counts will be elaborated further in daily time frame.
1) -DMI (red line) continue heading down with greater margin indicates bearish momentum is decreasing with penetrating below support at point R2 which signalling bear trend is still weakening.
2) +DMI (blue line) reversed up indicates bull strenght is in favor.
3) ADX (pink line) is still heading down with narrow margin which implying the volatility of the current trend is still low with uncertainty.
Therefore, the summations of the 3 signals above is implying uncertainty still remains and knee jerk reaction is unavoidable. From current situaton, +DMI had moving up above -DMI indicate bull strenght in in favor. However, a prominent trend has not been developed yet unless ADX start to curve up.
Prevailing trend could be emerged if levels listed below was broken:
Major Resistance - 1610
Immediate Resistance - 1545
Immediate Support - 1525, 1515, 1500, revised DT line to 1484
Support - revised UT line 1478
Dailly Time Frame
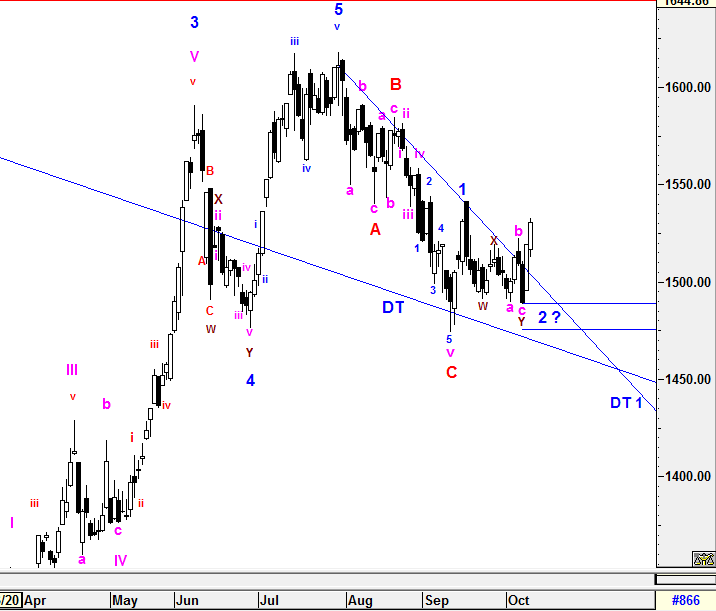
To recap from prior session, Wave 2 could form longer correction phase and had to be revisit and revised after some knee jerk reaction which led to complex waves formations.
From the current observation, Wave 2 did not perform an Zig-Zag Formation (5-3-5) as it did not breach below 1488 (61.8%) and 2 extra minutte legs were created at 1522.32 and 1489.56 instead. These has prolong the consolidaton and complex waves formation had been structured. The prior complex waves [abc(w)-(x)-i-ii-iii-iv-v (y)] would be catergozied as wave W which ended at 1491.17 and wave X ended at 1519.05. Then, wave Y would consist of the new three sub minutte wave abc as labelled. No doubt that the completion of wave Y would be in conjunction with Wave 2 if there is no more subsequence complex waves there after. Since it has broken out the DT 1 line convincingly, the tendency of trend reversal is increasing and added bullish signal. However, wave count confirmation rules are still required for projecting accurate movement. In this case, Wave 2 can be validated if KLCI manage to breach and close above the end of Wave 1 (1541.14) convincingly. If it does, Wave 3 would have started and the possible Wave 3 target would be at around 1556 or 1600.
On the other hand, the prior Higher Degree of Correction Waves will be revised If the prior low of wave C (1474.23) is breached. Therefore, the entire wave structure will still be monitored closely as complexity wave formations could be emerged such as WXY correction waves may take place before Higher Degree of 5 Waves Bull Run.
All waves' count and projected target are generated based on past/current price level and it may be subjected to vary if degree of momentum movement change.
Prevailing trend could be emerged if levels listed below was broken:
Resistance - 1610
Immediate resistance - 1531, 1538
Immediate Support - 1525,1515, 1503 (DT 1 line), 1496, revised DT line to 1484
Support - revised UT line 1478
=====================================================================
Is the SUPER CYCLE Bull Run required more complex waves formed? Let's see.
=====================================================================
Let's Mr Market pave the waves.
Trade safely
Wave Believer
More articles on KLCI waves
KLCI waves 94 - WILL THE DOWNWARD PRESSURE TO BE IMPULSIVE TOWARDS WAVE E?
Created by hotstock1975 | Jan 24, 2022
KLCI waves 93 - EXTENSION UPWARD ENDED AND IT'S TIME TO THE DOWNSIDE?
Created by hotstock1975 | Jan 17, 2022
KLCI waves 89 - KLCI WILL EXTEND AND HIT LOWER TARGETS GRADUALLY
Created by hotstock1975 | Dec 20, 2021
Featured Posts
Introducing MY's First IPO Fund for Sophisticated Investors!
New Update. Discover investment communities that resonate with your ideas
M & A Value Partners IPO Equity Fund has been launched - Targeted 13% Return p.a
Latest Videos


Apps


Top Articles
1
2
3
Koon Yew Yin's Blog
4
THE INVESTMENT APPROACH OF CALVIN TAN
5
save malaysia!
7
8
CEO Morning Brief
#
Stock
Score
Daily Stocks
Stock Name
Last
Change
Volume
Stock Name
Last
Change
Volume
MQ Trading Signals
Stock
Time
Signal
Duration
Stock
Time
Signal
Duration
Featured Advertisers / Partners


Ride The Bull Short The Bear
CS Tan
4.9 / 5.0
This book is the result of the author's many years of experience and observation throughout his 26 years in the stockbroking industry. It was written for general public to learn to invest based on facts and not on fantasies or hearsay....