


KLCI waves
KLCI waves 45 - Head & Shoulder Formation To Beat and BEST Glove Waves (HARTA & TOPGLOVE)

hotstock1975
Publish date: Sun, 14 Feb 2021, 10:37 AM
hotstock1975
0 101
Elliot wave analysis to measure price behavior for projecting next price actions
Weekly Time Frame
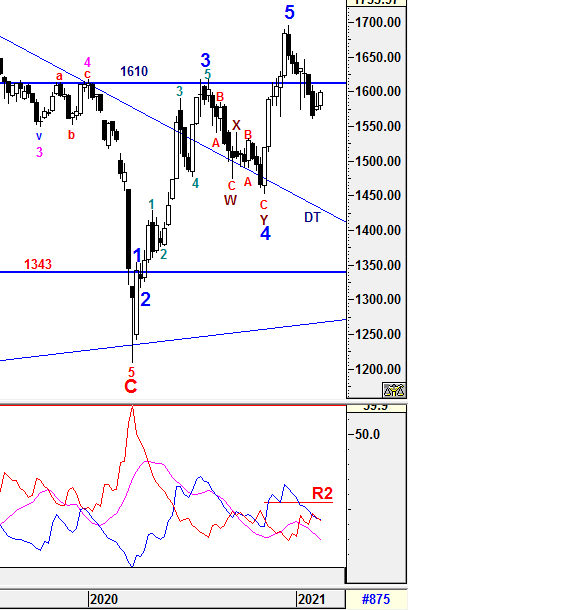
To recap, a Harami Candlestick Formation was formed which indicated trend reversal might be taken place but the validity of these formation realized if it able to close above 1600 on Thursday. However, the attemp to close above had failed and closed marginally just slight below 1600 at 1599.42. From shorter term, 1600 is still the level to watch for the validation of trend reversal. No doubt that, it is better off if KLCI could close above 1610 to re-established a stronger foot hold to the upside in longer run. An breach below 1572 could initiate an stronger selling pressure to the downside.
To reiterate, the Higher Degree of Correction waves are still being constrcuted after Wave 5 has been realized at 1695.87 instead of 1695.96. Subsequent minor waves would be elaborated further in daily time frame.
1) -DMI (red line) still heading down with narrow margin indicates bearish momentum is decreasing with slower pace.
2) +DMI (blue line) still heading down with narrow margin indicates bull strenght is still decreasing with slower pace and hovering below R2 indicates caution mode is still required.
3) ADX (pink line) still heading down with consistent margin implying that the volatility of the current trend is still low.
Therefore, the summations of the 3 signals above is still implying uncertainty is still emerging with narrow margin and caution is still required for any unexpected knee jerk reaction. From current situaton, Even +DMI has slightly above -DMI which indicates Bull strenght is in favor, the volatility is still low and continuous increased in ADX reading to would justify a prominent uptrend to be developed.
Prevailing trend could be emerged if Weekly levels listed below was broken:
Resistance - 1642, 1650, 1700, 1720
Immediate Resistance - 1600, 1610, 1621-1624, 1635
Immediate Support - 1590-1593, 1575, 1564, 1556,1530
Support - 1490, 1428 (DT line)
Daily Time Frame
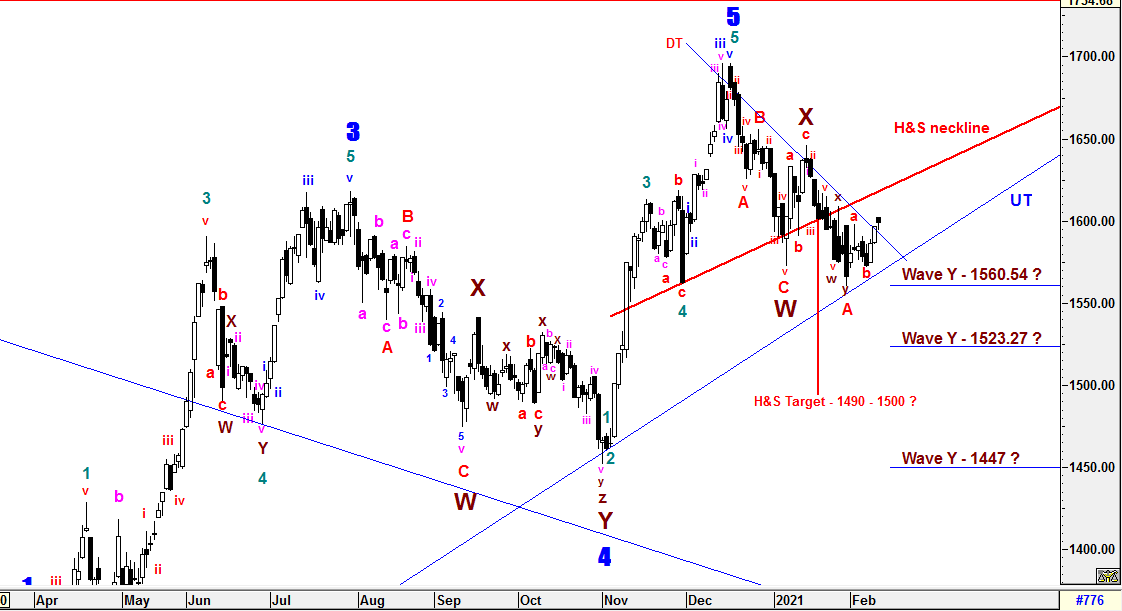
To recap, UT line was still the critical level to watch for validating the Head and Shoulder Formation breakout to the downside. Otherwise, the formation will be invalid if it able to move up and close above H&S neckline convincingly. On wave count perspective, sub minuette wave y had ended at 1560.54 and complex sub minuette waves 1-2-3-4-5 (w)-x-y had been completed In conjunction with wave A. Besides that, sub minuette wave a (5 waves) and b (3 waves) had been formed, sub minuette wave c could be on its way towards completion of wave B at higher level. Any further rebound might be resisted at H&S neckline where wave B could be ended at around 1598-1613.
Currently, there was an minor revision on wave b which embeded at minor complex waves to complete 3 sub minuette waves to prolong the completion. Besides that, wave c has already being constructed and has met wave B's minimum criteria of 1598-1613 to closed at 1599. However, i will not rule out that wave B could end higher as it has breached the DT line as shown.
Since KLCI is still moving in between H&S neckline and UT line channel, i am still holding my view for any possible UT line breaching which might lead Wave Y be ended at 3 possible targets at 1523 (FIBO 100%), 1447 (161.8%) or Head and Shoulder Formation breakout target (1490-1500).
The entire wave structures will still be monitored closely if the high of Wave X at 1646.24 is breached which indicates Higher Degree of implusive Wave 1 could have emerged. If it is true, Wave Y would be revised and ended at 1560.54 instead of wave A since it had met the minimum criteria of FIBO 61.8%(1571). Thereafter, a new set of Higher Degree of 5 Waves Bull Run may take place and Primary Wave 3 would be emerged which i should label from the start. Thanks for an input from an 3i member on the Highest Degree/Primary Waves labelled counts.
All waves' count and projected target are generated based on past/current price level and it may be subjected to vary if degree of momentum movement change.
Prevailing trend could be emerged if Daily levels listed below was broken:
Resistance - 1639-1631, 1650, 1662, 1679, 1685, 1700, 1720
Immediate resistance - 1601, 1610, 1615, 1620
Immediate Support - 1594-1596, 1590, 1584, 1572, 1560, 1554-1551, 1538-1545
Support - 1530, 1490
HARTA & TOPGLOVE Waves
==================
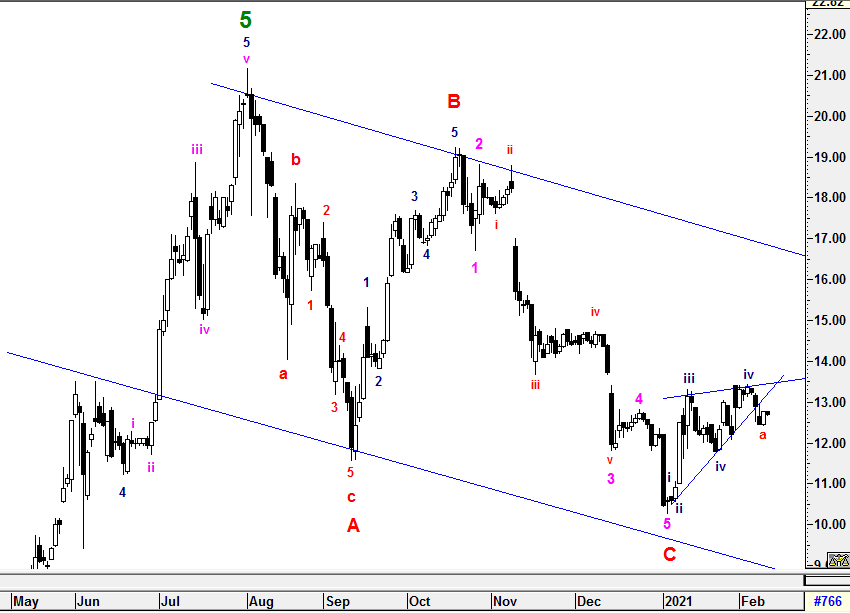
HARTA
=====
To recap, 5th sub minuete wave was still being constructed with possible extension waves emerge. Currently, it has been consolidated and forming an bullish pennant for an possible breakout but being resisted at the gap in between RM13.40 and 13.66. If it able to pass through these gap, there would be 5th wave extension emerged.
However, the gap resistance was too strong to be breached and led to end 5th sub minuete wave at RM13.44 to form an Ending Diagonal Formation. I have re-labelled the current counts with Roman numerals instead to justify the current trend. Currently, sub minuette correction abc wave is being constructed with wave a could have completed.
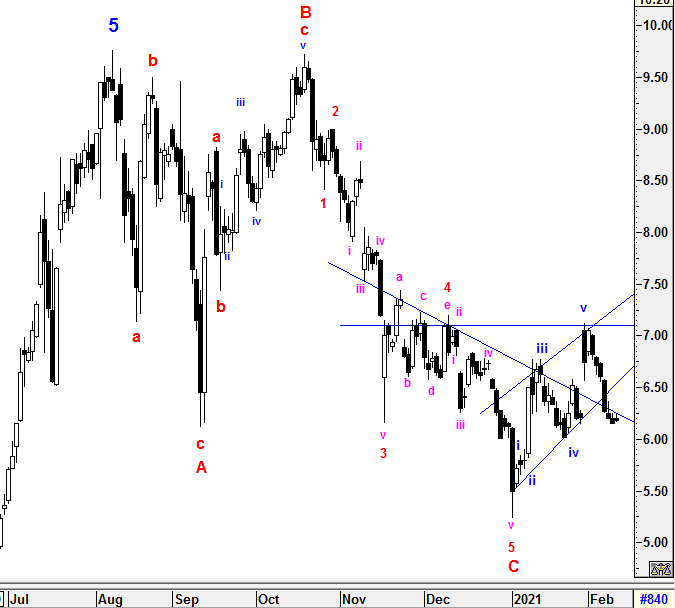
TOPGLOVE
=======
For recap, 5 sub minuette waves could have completed and correction minuette waves are still underway which would be end soon at around 6.51- 6.52. I believe the ascending channel (Diagonal Formation) could initiate an impulsive wave to the upside. Otherwise, the correction phase would be extended if lower channel line breach.
No doubt that, selling pressure continued after lower channel line could not hold and breached. However, the correction minuette waves have met the minimum criteria of FIBO level 76.4% which indicates the current correction could end soon.
More articles on KLCI waves
KLCI waves 94 - WILL THE DOWNWARD PRESSURE TO BE IMPULSIVE TOWARDS WAVE E?
Created by hotstock1975 | Jan 24, 2022
KLCI waves 93 - EXTENSION UPWARD ENDED AND IT'S TIME TO THE DOWNSIDE?
Created by hotstock1975 | Jan 17, 2022
KLCI waves 89 - KLCI WILL EXTEND AND HIT LOWER TARGETS GRADUALLY
Created by hotstock1975 | Dec 20, 2021
Discussions
Be the first to like this. Showing 0 of 0 comments
Post a Comment
Featured Posts
Introducing MY's First IPO Fund for Sophisticated Investors!
New Update. Discover investment communities that resonate with your ideas
M & A Value Partners IPO Equity Fund has been launched - Targeted 13% Return p.a
Latest Videos


Apps


Top Articles
1
The Alpha Trader
3
Rakuten Trade Research Reports
4
南洋行家论股
7
TA Sector Research
8
BFM Podcast
#
Stock
Score
Daily Stocks
Stock Name
Last
Change
Volume
Stock Name
Last
Change
Volume
Stock Name
Last
Change
Volume
MQ Trading Signals
Stock
Time
Signal
Duration
Stock
Time
Signal
Duration
Featured Advertisers / Partners


Ride The Bull Short The Bear
CS Tan
4.9 / 5.0
This book is the result of the author's many years of experience and observation throughout his 26 years in the stockbroking industry. It was written for general public to learn to invest based on facts and not on fantasies or hearsay....