


KLCI waves
KLCI waves 47 - Would KLCI Get Hit After Head & Shoulder Formation Realized? HARTA & TOPGLOVE Waves Update

hotstock1975
Publish date: Sat, 27 Feb 2021, 09:29 PM
hotstock1975
0 101
Elliot wave analysis to measure price behavior for projecting next price actions
Monthly Time Frame
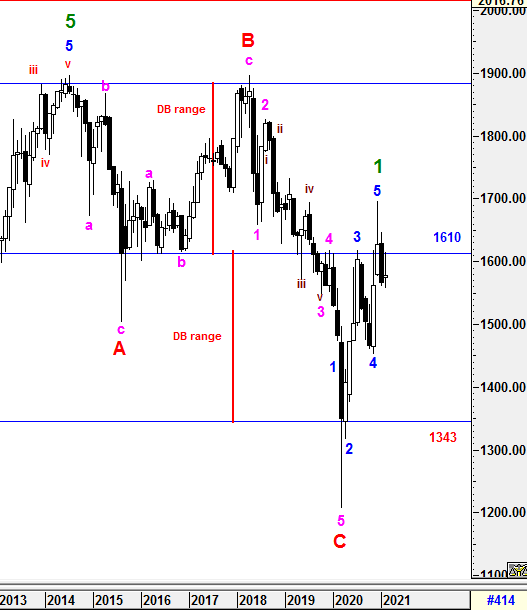
KLCI had made an false breakout above and retraced below 1610 based on Dec 2020 and Jan 2021 closing. Thus, an Bearish Engulfing Formation has been structured and yet to be realized unless KLCI break and close below 1566.4 on the coming March month end.
On wave counts perspective, Primary Wave 1 could be formed after 5 Higher Degree of Impulsive Waves had been structured from March to Dec 2020. No doubt that Primary Wave 2 correction is underway which expected to be a prolong waves unless a unknown catalyst emerged to re-write the extension waves within. Therefore, smaller time frame would be monitor closely for any unexpected waves incurred. Subsequent minor waves would be elaborated further in daily time frame.
To reiterate, the double top formation structure formed in between July 2014 and April 2018 could be overwritten by Primary Wave 3 Bull Run when Primary Wave 2 Correction end.
The new Super Cycle Bull Wave is still valid and expecting some knee jerk reactions along the prolong cycle.
Prevailing trend could be emerged if Monthly levels listed below was broken:
Resistance : 1610
Support : 1560, 1525-1530, 1500, 1465
Weekly Time Frame
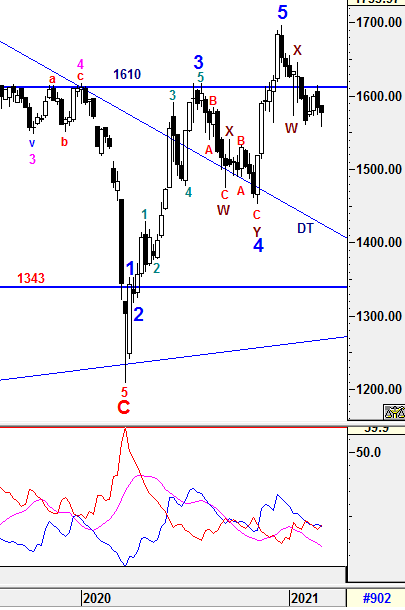
To recap, KLCI was still failed to close above 1610 and Dark Cloud Cover candle formation had been formed which indicated selling pressure would in favor. These formation would be confirmed if KLCI breached and closed below 1580 on coming Friday.
No doubt that selling continued after 1580 was breached and closed below 1580 after few attempts of rebound. These has realized Dark Cloud Cover formation which indicates weaknesses in coming weeks.
To reiterate, the Higher Degree of Correction waves are still being constrcuted after Wave 5 has been realized at 1695.87 instead of 1695.96. Subsequent minor waves would be elaborated further in daily time frame.
1) -DMI (red line) curved up with greater margin indicates bearish momentum is increasing.
2) +DMI (blue line) curved down with greater margin indicates bull strenght is decreasing.
3) ADX (pink line) still heading down with consistent margin implying that the volatility of the current trend is still low
.
Therefore, the summations of the 3 signals above is still implying uncertainty is still emerging and caution is still required for any unexpected knee jerk reaction. From current situaton, +DMI has crossed below -DMI which indicates Bear strenght is in favor and expecting these both lines to be hovering with a criss-crossed before clearer signal emerged. However, the volatility is still low and continuous increased in ADX reading would justify a prominent uptrend to be developed.
Prevailing trend could be emerged if Weekly levels listed below was broken:
Resistance - 1642, 1650, 1700, 1720
Immediate Resistance - 1580, 1590-1593, 1600, 1610, 1621-1624, 1635
Immediate Support - 1575, 1564, 1556,1530
Support - 1490, 1423 (DT line)
Daily Time Frame
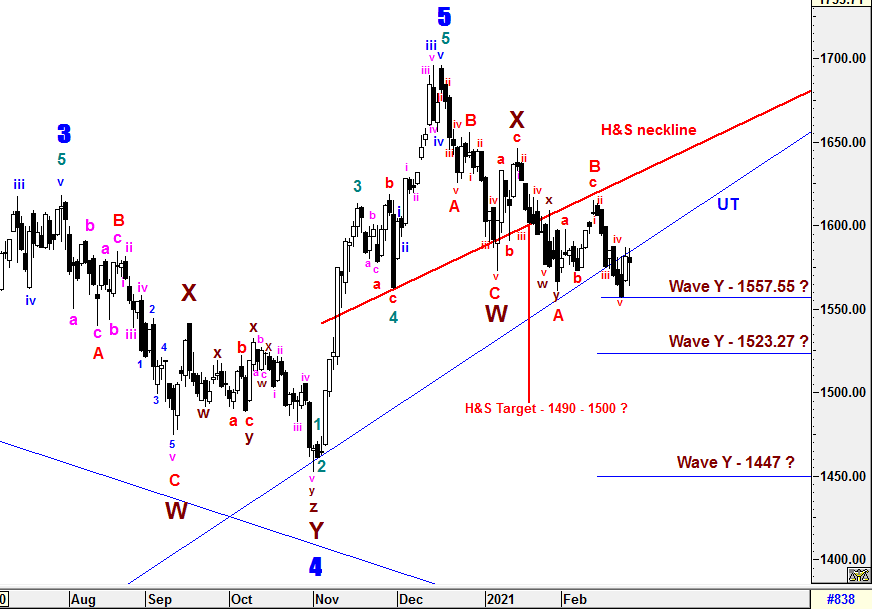
To recap from session 46, wave C could be constructed towards to the downside with 5 sub minuette waves structure (i-ii-iii extension completed) and sub minuette wave iv could still being constructed before wave v to end wave C which would end Wave Y in conjunctionally. Even the UT line had provided a good support for the immediate rebound, I was still be very caution for any possible complex minuette waves structure.
Currently, the 5 sub minuette waves structure (i-ii-iii extension - iv- iv extension) has been completed. Although the minimum criteria of wave C and Wave Y have met, i won't rule out that the current correction could end lower since UT line had been breached and strongly resisted beneath which might lead wave C and Wave Y be ended at 3 possible targets at 1523 (FIBO extension 100%), 1447 (FIBO extension 161.8%) or Head and Shoulder Formation breakout target (1490-1500). Unless KLCI manage to move back above UT line and breach above wave B at 1614.92 to justify the end of wave C at 1557.55.
The entire wave structures will still be monitored closely if the high of Wave X at 1646.24 is breached which indicates Higher Degree of implusive Wave 1 could have emerged. If it is true, Wave Y would be ended at 1557.55. Thereafter, a new set of Higher Degree of 5 Waves Bull Run may take place and Primary Wave 3 would be emerged which i should label from the start. Thanks for an input from an 3i member on the Highest Degree/Primary Waves labelled counts.
All waves' count and projected target are generated based on past/current price level and it may be subjected to vary if degree of momentum movement change.
Prevailing trend could be emerged if Daily levels listed below was broken:
Resistance - 1639-1631, 1650, 1662, 1679, 1685, 1700, 1720
Immediate resistance - 1581, 1586, 1595-1600, 1606, 1610, 1615, 1620
Immediate Support - 1572, 1566, 1554-1551, 1538-1545
Support - 1530, 1490
HARTA & TOPGLOVE Waves
==================
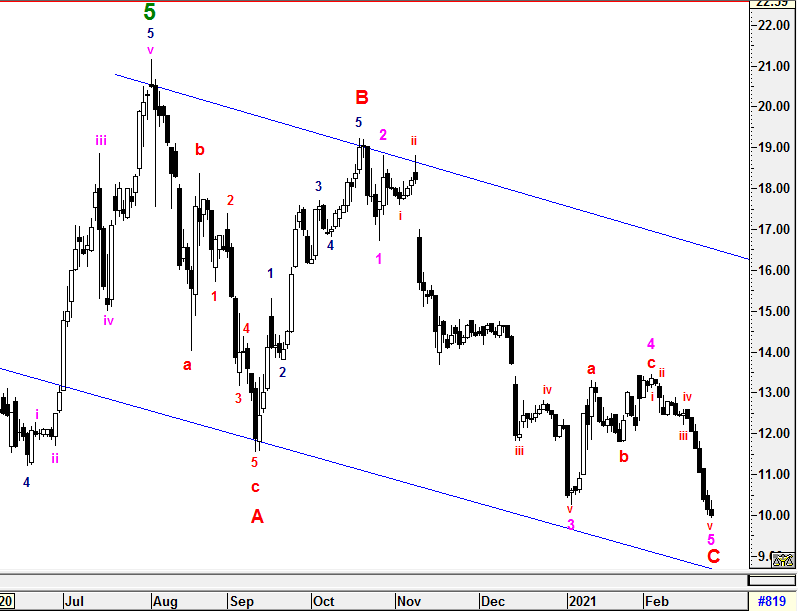
HARTA
=====
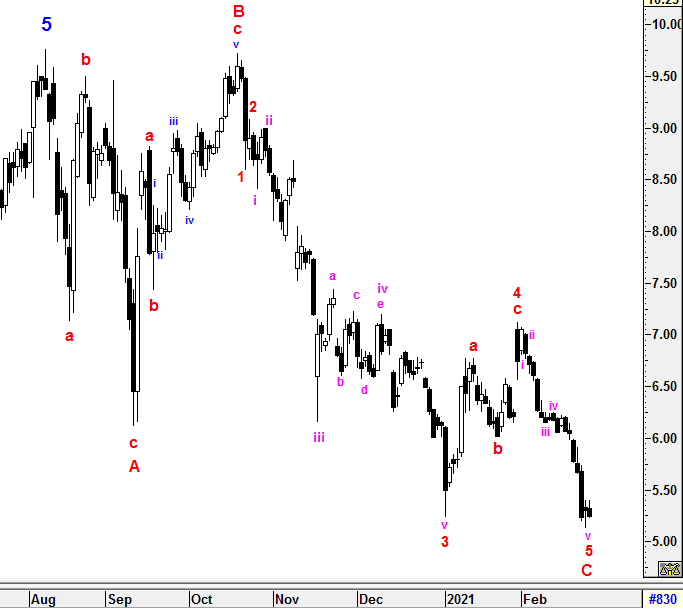
To recap from sesson 46, i won't rule out that it would hit two potential targets of wave c at RM11.93 (FIBO 100%) or RM11.33 (FIBO 161.8%) to complete minuette wave 2 correction and the entire wave structures will still be monitored closely and revised if the low of Wave C (RM10.24) was breached which indicated new sub minuette extension waves within Wave C could emerged.
Due to strong momentum to the downside, the low of Wave C (RM10.24) had breached and some wave counts have been revised as shown for example minuette wave 1 has been revised as abc correction waves.
From the revision, we can see the correction has met the minumum criteria to complete the ABC correction cycle. Due to the strong momentum, the current correction waves are still being monitored closely for any extension or complex waves within until a clear trend reversal signal emerged.
TOPGLOVE
=======
To recap from session 46, the correction minuette waves had been structured as 5 sub minuette waves (i-ii-iii-iv-v) which had met the minimum criteria to end minuette wave 2 correction at 100% FIBO level at around prior sub minuette wave iv. Otherwise, i will be watching it closely whether there would be any extension waves before the end of correction and revised if the low of Wave C (RM5.23) was breached which indicated new sub minuette extension waves within Wave C could emerged.
Due to strong momentum change, the sub minuette waves v had initiated an extension waves to the downside and breached the low of Wave C (RM5.23). As similar as HARTA, wave counts have been revised such as minuette wave 1 has been revised as abc correction waves.
From the revision, we can see the correction has met the minumum criteria to complete the ABC correction cycle. Due to the strong momentum, the current correction waves are still being monitored closely for any extension or complex waves within until a clear trend reversal signal emerged.
==================================================================================
Patient is required for the SUPER CYCLE Bull Run.
==================================================================================
Let's Mr Market pave the waves.
Trade safely
Wave Believer
More articles on KLCI waves
KLCI waves 94 - WILL THE DOWNWARD PRESSURE TO BE IMPULSIVE TOWARDS WAVE E?
Created by hotstock1975 | Jan 24, 2022
KLCI waves 93 - EXTENSION UPWARD ENDED AND IT'S TIME TO THE DOWNSIDE?
Created by hotstock1975 | Jan 17, 2022
KLCI waves 89 - KLCI WILL EXTEND AND HIT LOWER TARGETS GRADUALLY
Created by hotstock1975 | Dec 20, 2021
Discussions
Be the first to like this. Showing 0 of 0 comments
Post a Comment
Featured Posts


Latest Videos


Apps


Top Articles
1
The Alpha Trader
3
Rakuten Trade Research Reports
4
南洋行家论股
7
TA Sector Research
8
BFM Podcast
#
Stock
Score
Daily Stocks
Stock Name
Last
Change
Volume
Stock Name
Last
Change
Volume
Stock Name
Last
Change
Volume
MQ Trading Signals
Stock
Time
Signal
Duration
Stock
Time
Signal
Duration
Featured Advertisers / Partners


Ride The Bull Short The Bear
CS Tan
4.9 / 5.0
This book is the result of the author's many years of experience and observation throughout his 26 years in the stockbroking industry. It was written for general public to learn to invest based on facts and not on fantasies or hearsay....