


KLCI waves
KLCI waves 53 - Is Complex Corrective Wave Z Ended To Charge KLCI Bull Run ?

hotstock1975
Publish date: Sat, 10 Apr 2021, 11:22 PM
hotstock1975
0 101
Elliot wave analysis to measure price behavior for projecting next price actions
Weekly Time Frame
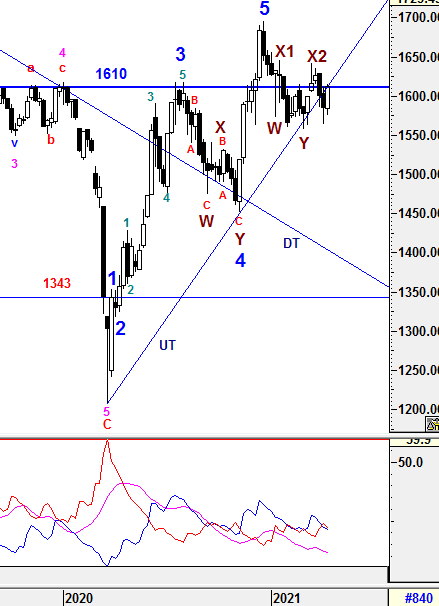
To recap from prior session 52, the selling momentum continued and UT line was breached. Although there were minor rebound, consolidation phase would be emerged before any clearer reversal signal take place. 1610 is still the level to watch for long run.
For the past 1 week, KLCI was able to rebound and closed at 1612.25 which was slighlty above the all time level 1610 and UT line. Besides that, an Bullish Engulfing Candle has been formed indicates bull strenght could spill over to following week and the upside bias could lead to 1626 if the momentum continue. However, i would rather be caution unless KLCI can sustain above UT line or 1610 for few more weeks to develope stronger foothold for further upside.
From wave count perspective, the Higher Degree of Correction wave would be prolong with Multiple WXYXZ complex waves before a new set of Higher Degree of Bull Wave take place. Subsequent minor waves would be elaborated further in daily time frame.
1) -DMI (red line) curveddown with lower margin indicates bearish momentum is decreasing with lower pace.
2) +DMI (blue line) continue heading down with lower margin indicates bull strenght is still decreasing with lower pace.
3) ADX (pink line) continue heading down implying that the volatility of the current trend is decreasing and still very low.
Therefore, the summations of the 3 signals above is still implying Bear strength is in favor and caution is still required for any unexpected knee jerk reaction. From current situaton, +DMI is still below -DMI lines with narrow spread indicating the current bear strength is in favor and consolidating before regaining the momentum in coming weeks. The current volatility is still low and continuous increased in ADX reading would justify a prominent uptrend to be developed.
Prevailing trend could be emerged if Weekly levels listed below was broken:
Resistance - 1633, 1642, 1650, 1700, 1720
Immediate Resistance - 1615, 1619 , 1627
Immediate Support - 1607-1610, 1600, 1580, 1575-1577
Support - 1564, 1556, 1530
Daily Time Frame
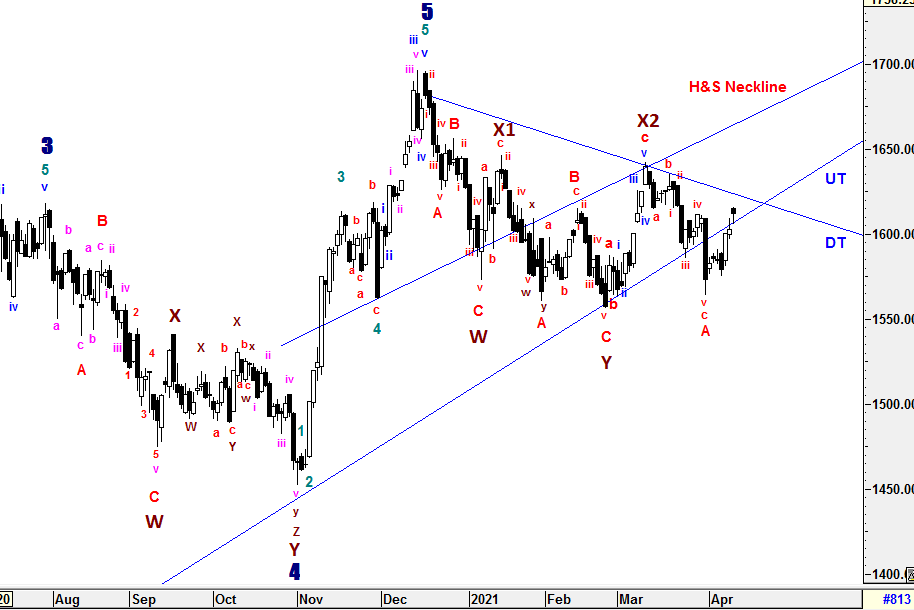
To recap from session 52, wave C had taken place to the downside which had met the minimum criteria of FIBO 61.8%. Currently, sub minuette wave i-ii-iii of wave C was believed to be completed and wave iv/v were still pending. Therefore, i won't rule out that the downside target would be achieved at lower lever but limited margin unless there would be new extension waves take place within wave C.
For the past 1 week, KLCI had passed above 1611.28 and sub minuette wave v of wave c had been enforced to complete at 1664.06 in conjunction with wave A. Therefore, wave B is on it way up which has met the minimum criteria of FIBO 61.8% at 1612. Since it has returned above UT line, we might see it could test at higher level at 1623 (FIBO 76.4%) and DT line would be the resistance line to watch. To reiterate, Wave Z could be formed in various correctives wave structure (Zig-Zag, Flat, Diagonal and etc) with momentum changes along the way.
Since Multiple Complex Wave emerged, the new set of Higher Degree of 5 Waves Bull Run or Primary Wave 3 have yet to be seen until all corrective waves are served convicingly. Thus, Higher Degree of Correction is still being prolong by these Multiple Complex Waves WXYXZ.
The entire wave structures will still be monitored closely if the high of Wave X1 (1646.24) is penetraded which indicates Higher Degree of implusive Wave 1 could have emerged. Thereafter, a new set of Higher Degree of 5 Waves Bull Run may take place and Primary Wave 3 would be emerged. On the hand, the prior Higher Degree of Correction would be prolong if Wave Y (1557.55) breached.
All waves' count and projected target are generated based on past/current price level and it may be subjected to vary if degree of momentum movement change.
Prevailing trend could be emerged if Daily levels listed below was broken:
Resistance - 1645, 1650, 1662, 1679, 1685, 1700, 1720
Immediate resistance - 1615, 1620, 1625-1628, 1639
Immediate Support - 1608, 1600, 1595-1597, 1585, 1580, 1572
Support - 1566, 1554-1551, 1538-1545
==================================================================================
Patient is required for the SUPER CYCLE Bull Run.
==================================================================================
Let's Mr Market pave the waves.
Trade safely
Wave Believer
More articles on KLCI waves
KLCI waves 94 - WILL THE DOWNWARD PRESSURE TO BE IMPULSIVE TOWARDS WAVE E?
Created by hotstock1975 | Jan 24, 2022
KLCI waves 93 - EXTENSION UPWARD ENDED AND IT'S TIME TO THE DOWNSIDE?
Created by hotstock1975 | Jan 17, 2022
KLCI waves 89 - KLCI WILL EXTEND AND HIT LOWER TARGETS GRADUALLY
Created by hotstock1975 | Dec 20, 2021
Discussions
Be the first to like this. Showing 0 of 0 comments
Post a Comment
Featured Posts


Latest Videos


Apps


Top Articles
1
The Alpha Trader
3
Rakuten Trade Research Reports
4
南洋行家论股
7
TA Sector Research
8
BFM Podcast
#
Stock
Score
Daily Stocks
Stock Name
Last
Change
Volume
Stock Name
Last
Change
Volume
Stock Name
Last
Change
Volume
MQ Trading Signals
Stock
Time
Signal
Duration
Stock
Time
Signal
Duration
Featured Advertisers / Partners


Ride The Bull Short The Bear
CS Tan
4.9 / 5.0
This book is the result of the author's many years of experience and observation throughout his 26 years in the stockbroking industry. It was written for general public to learn to invest based on facts and not on fantasies or hearsay....