


KLCI waves
KLCI waves 57 - Is KLCI Wave Z Ended Or DIAMOND FORMATION Still To RULE ?

hotstock1975
Publish date: Sun, 09 May 2021, 02:07 PM
hotstock1975
0 101
Elliot wave analysis to measure price behavior for projecting next price actions
Weekly Time Frame
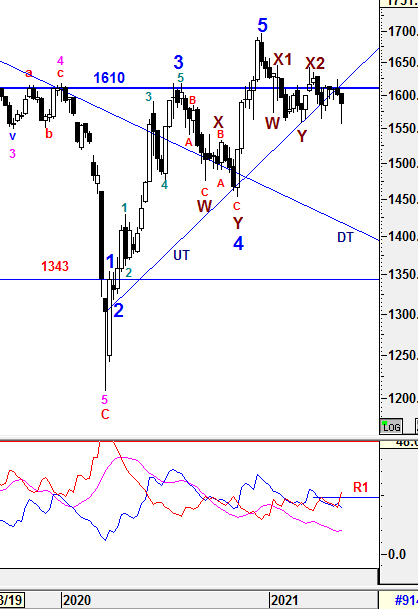
To recap from prior session 56, KLCI had retested towards higher level but resisted at 1627 and retraced back to consolidation area. By closing above 1598.57, Bullish Engulfing setup was still could be validated if KLCI to close above 1612.25 convincingly. However, i was very caution since KLCI was still yet to move and close above 1610 convincingly unless we could see more formidable closing in next few weeks.
For the past 1 week, the COVID situation had intensified which weakening the momentum further for initiating another sold off to breach off from the consolidation area and rebound from one of the major support 1556. These rebound had brought the index back with forming an Inverted Hammer and closed above the Bullish Engulfing Setup range 1584 -1612 which could still be validating the Bullish Setup even it was not above 1598.57. However, there might be a chance to realize these Engulfing Setup if KLCI is able to close above the high of the Inverted Hammer at 1602.09 on next Friday. As mentioned above, we would like to see KLCI to close above 1610 for few weeks convincingly to justify an formidable trend for longer run.
From wave count perspective, the Higher Degree of Correction wave would be prolong with Multiple WXYXZ complex waves before a new set of Higher Degree of Bull Wave take place. Subsequent minor waves would be elaborated further in daily time frame.
1) -DMI (red line) curved up with higher margin penetraded above R1 indicates bearish momentum is increasing with higher pace and weaknesses ahead.
2) +DMI (blue line) curved down with higher margin indicates bull strenght is decreasing with higher pace.
3) ADX (pink line) curved up with higher margin implying that the volatility of the current trend is increasing but still very low.
Therefore, the summations of the 3 signals above is still implying Bear strength is in favor and caution is still required for any unexpected knee jerk reaction. From current situaton, +DMI is below -DMI lines with higher spread indicating the Bear strength is in favor with improving volitality which indicates weakness may still emerging in coming weeks. The current volatility is still low and continuous increased in ADX reading would justify a prominent uptrend to be developed.
Prevailing trend could be emerged if Weekly levels listed below was broken:
Resistance - 1633, 1642, 1650, 1700, 1720
Immediate Resistance - 1600, 1610, 1615, 1619 , 1627
Immediate Support - 1580, 1575-1577
Support - 1564, 1556, 1530, 1510, 1500
Daily Time Frame
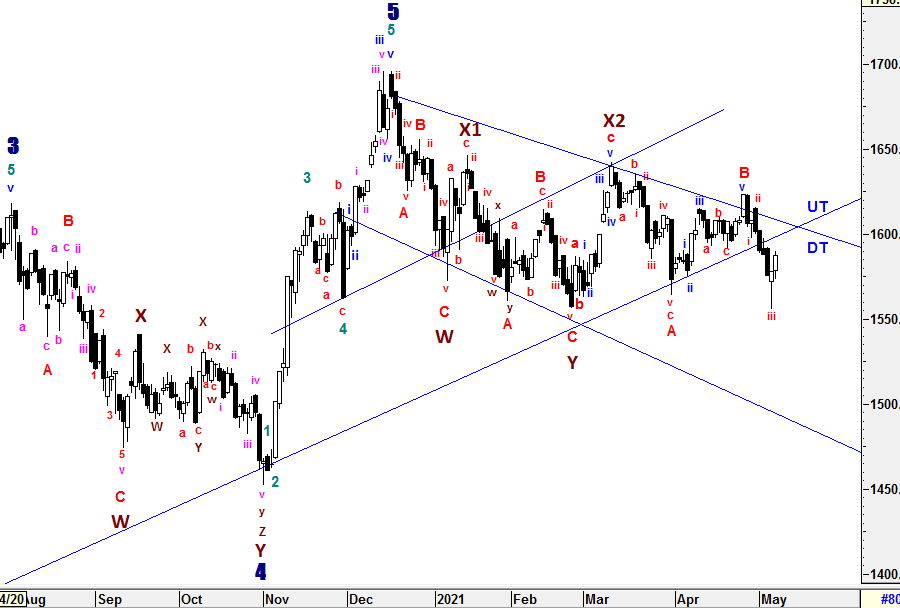
To recap from session 56, we could see wave C construction starting from now to the downsides which could lead to a possible target in between 1575 (FIBO 61.8%) to 1545 (FIBO 100%) and the Diamond Formation which provided 2 possible theoretical targets if breaokout event emerged in either direction (Upside target - 1700 or Downside target - 1500 > equivalent to extension wave target 161.8%).
Currently, wave C might still yet to be realized even it went down to meet the minimum criteria region in between 1575 (FIBO 61.8%) to 1545 (FIBO 100%). I am assuming wave C to be constructed with 5 waves structure unless 1597.79 or 1623.47 being penetraded to the upside. If the 5 waves structure valid, sub minuette wave iii had been completed and sub minuette wave iv would be ended soon at slightly higher level which beneath UT line then sub minuette wave v would take place to revisit the mentioned FIBO region again. As mentioned before, the Higher Degree of Correction would be prolong if Wave Y (1557.55) breached and it was triggered as low as 1556 on last Thursday. On the other hand, the Diamond Formaton's target is still possible if extenson wave emerged. Therefore, i won't rule out that any possibility may come if bearish extension waves emerged along the way to end wave C or Wave Z at lower level simultinously.
To reiterate, Wave Z could be formed in various correctives wave structure (Zig-Zag, Flat, Diagonal and etc) with momentum changes.
Since Multiple Complex Wave emerged, the new set of Higher Degree of 5 Waves Bull Run or Primary Wave 3 have yet to be seen until all corrective waves are served convicingly. Thus, Higher Degree of Correction is still being prolong by these Multiple Complex Waves WXYXZ.
The entire wave structures will still be monitored closely if the high of Wave X1 (1646.24) is penetraded which indicates Higher Degree of implusive Wave 1 could have emerged.
All waves' count and projected target are generated based on past/current price level and it may be subjected to vary if degree of momentum movement change.
Prevailing trend could be emerged if Daily levels listed below was broken:
Resistance - 1645, 1650, 1662, 1679, 1685, 1700, 1720
Immediate resistance - 1592, 1595-1597, 1600, 1608-1610, 1615, 1620, 1625-1628, 1639
Immediate Support - 1578, 1572, 1566, 1554-1551
Support - 1538-1545, 1530,1518,1500
Patient is required for the SUPER CYCLE Bull Run.
==================================================================================
Let's Mr Market pave the waves.
Trade safely
Wave Believer
More articles on KLCI waves
KLCI waves 94 - WILL THE DOWNWARD PRESSURE TO BE IMPULSIVE TOWARDS WAVE E?
Created by hotstock1975 | Jan 24, 2022
KLCI waves 93 - EXTENSION UPWARD ENDED AND IT'S TIME TO THE DOWNSIDE?
Created by hotstock1975 | Jan 17, 2022
KLCI waves 89 - KLCI WILL EXTEND AND HIT LOWER TARGETS GRADUALLY
Created by hotstock1975 | Dec 20, 2021
Discussions
Be the first to like this. Showing 0 of 0 comments
Post a Comment
Featured Posts


Latest Videos


Apps


Top Articles
1
The Alpha Trader
3
Rakuten Trade Research Reports
4
南洋行家论股
7
TA Sector Research
8
BFM Podcast
#
Stock
Score
Daily Stocks
Stock Name
Last
Change
Volume
Stock Name
Last
Change
Volume
Stock Name
Last
Change
Volume
MQ Trading Signals
Stock
Time
Signal
Duration
Stock
Time
Signal
Duration
Featured Advertisers / Partners


Ride The Bull Short The Bear
CS Tan
4.9 / 5.0
This book is the result of the author's many years of experience and observation throughout his 26 years in the stockbroking industry. It was written for general public to learn to invest based on facts and not on fantasies or hearsay....