


KLCI waves
KLCI waves 60 - Will KLCI Go Lower OR The End Wave Z Correction?

hotstock1975
Publish date: Sun, 30 May 2021, 11:56 PM
hotstock1975
0 101
Elliot wave analysis to measure price behavior for projecting next price actions
Weekly Time Frame
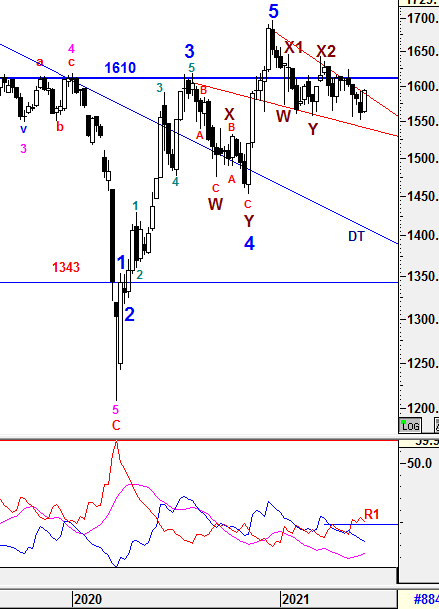
To recap from prior session 59, KLCI had moved to lower level and closed below one of the immediate support of 1564 at 1562.17 which reflecting the consolidation phase would be prolong. To reiterate, we would like to see KLCI to close above 1610 for few weeks convincingly to justify an formidable trend to the upside for longer run.
{{{{{{{
For the past 1 weeks, KLCI has rebounded and closed up strongly at 1594.44 but still beneath the pyschology level of 1600. From December 2020 until now, an Falling Wedge Pattern has been structered which indicated an continous trend could soon be initiated if breakout emerged either side. I will assume that these pattern is bias to the upside and will be validated if KLCI is able to close above 1610 for weeks convincingly in order to justify an formidable trend to the upside for longer run. However, i will be caution until a clearer breakout signal emerged.
}}}}}}}
From wave count perspective, the Higher Degree of Correction wave would be prolong with Multiple WXYXZ complex waves before a new set of Higher Degree of Bull Wave take place. Subsequent minor waves would be elaborated further in daily time frame.
1) -DMI (red line) curved down with greater margin indicates bear strenght is decreasing but still staying above R1 indicates bearish sentiment is still in favor.
2) +DMI (blue line) still heading down with lower margin indicates bull strenght is decreasing with lower pace.
3) ADX (pink line) still heading up with consistent margin implying that the volatility of the current trend is still increasing but still low.
Therefore, the summations of the 3 signals above is still implying Bear strength is in favor and caution is still required for any unexpected knee jerk reaction. From current situaton, +DMI is still below -DMI lines with decreasing spread which indicating the Bear strength is still in favor with consistent volitality. This indicates that weakness may still emerging in coming weeks. The current volatility is improving but still low and continuous rise in ADX reading would justify a prominent uptrend to be developed.
Prevailing trend could be emerged if Weekly levels listed below was broken:
Resistance - 1627, 1633, 1642, 1650, 1700, 1720
Immediate Resistance - 1600, 1610, 1615, 1619
Immediate Support - 1588, 1585, 1575-1577, 1564,
Support - 1556, 1541, 1530, 1510, 1500
Daily Time Frame
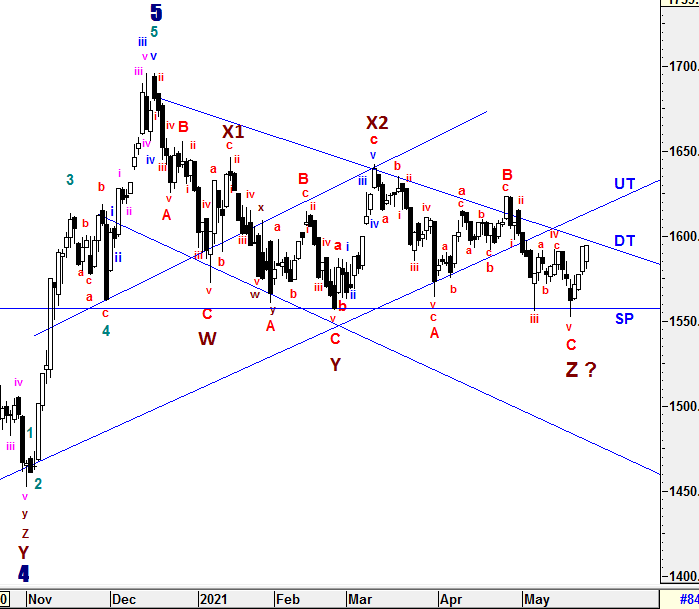
To recap from session 59, I was seeing sub minuette wave v was not ended yet as minuette extension waves emerged. Therefore, i won't rule out that sub minuette wave v would end lower and any rebound could be shortlive to prolong the correction phase which could end in between the FIBO region in between 1575 (FIBO 61.8%) to 1545 (FIBO 100%) in conjunction with wave C or Wave Z simultinously. Indeed, the Diamond Formaton's target (1500) is still possible if extenson wave emerged. Unless, KLCI was able to penetrade above 1592.57 to justify the end of sub minuette wave v. On the other hand, KLCI made a rebound from SP line and would act as immediate support for shorter term to the upside if sustainable.
{{{{{{{
Due to the magnitide of the momentum changes, there are revision of sub minuette waves on wave B from 5 minuette waves to 3 minuette waves structure as shown. For the past 1 week, KLCI was able to penetrade above 1592.57 and sub minuette wave v has been justified to end at 1552.07 in between the FIBO region. In this case, wave C should have ended simultinously. Therefore, the eitire wave ABC structure from Wave X2 has been formed as 3-3-5 FLAT Formation structure. However, i am still monitoring closely whether Wave Z could have ended at this point too as i am still leaving some room for Wave Z to be justified by a strong clearer signal if KLCI could penetrade both DT and UT line convincingly. Since DT and UT line have yet to be penetraded, i won't rule out that there could be more Complex Waves formations if the current rebound is shortlive. Therefore, the SP line is still acting an critical immediate support for shorter term to the upside if sustainable.
}}}}}}}
To reiterate, Wave Z could be formed in various correctives wave structure (Zig-Zag, Flat, Diagonal and etc) with momentum changes.
Since Multiple Complex Wave emerged, the new set of Higher Degree of 5 Waves Bull Run or Primary Wave 3 have yet to be seen until all corrective waves are served convicingly. Thus, Higher Degree of Correction is still being prolong by these Multiple Complex Waves WXYXZ.
The entire wave structures will still be monitored closely if the high of Wave X1 (1646.24) is penetraded which indicates Higher Degree of implusive Wave 1 could have emerged.
All waves' count and projected target are generated based on past/current price level and it may be subjected to vary if degree of momentum movement change.
Prevailing trend could be emerged if Daily levels listed below was broken:
Resistance - 1615, 1620, 1625-1628, 1639, 1645, 1650, 1662, 1679, 1685, 1700, 1720
Immediate resistance - 1595-1597, 1600, 1608-1610
Immediate Support - 1592, 1587, 1578, 1572, 1566, 1556-1551, 1538-1545
Support - 1530, 1518, 1500
==================================================================================
Patient is required for the SUPER CYCLE Bull Run.
==================================================================================
Let's Mr Market pave the waves.
Trade safely
Wave Believer
More articles on KLCI waves
KLCI waves 94 - WILL THE DOWNWARD PRESSURE TO BE IMPULSIVE TOWARDS WAVE E?
Created by hotstock1975 | Jan 24, 2022
KLCI waves 93 - EXTENSION UPWARD ENDED AND IT'S TIME TO THE DOWNSIDE?
Created by hotstock1975 | Jan 17, 2022
KLCI waves 89 - KLCI WILL EXTEND AND HIT LOWER TARGETS GRADUALLY
Created by hotstock1975 | Dec 20, 2021
Discussions
Be the first to like this. Showing 0 of 0 comments
Post a Comment
Featured Posts


Latest Videos


Apps


Top Articles
1
The Alpha Trader
3
Rakuten Trade Research Reports
4
南洋行家论股
7
TA Sector Research
8
BFM Podcast
#
Stock
Score
Daily Stocks
Stock Name
Last
Change
Volume
Stock Name
Last
Change
Volume
Stock Name
Last
Change
Volume
MQ Trading Signals
Stock
Time
Signal
Duration
Stock
Time
Signal
Duration
Featured Advertisers / Partners


Ride The Bull Short The Bear
CS Tan
4.9 / 5.0
This book is the result of the author's many years of experience and observation throughout his 26 years in the stockbroking industry. It was written for general public to learn to invest based on facts and not on fantasies or hearsay....