


KLCI waves
KLCI waves 62 - KLCI To Succumb Prolong Consolidation Before Breakout

hotstock1975
Publish date: Sun, 13 Jun 2021, 03:37 PM
hotstock1975
0 101
Elliot wave analysis to measure price behavior for projecting next price actions
Weekly Time Frame
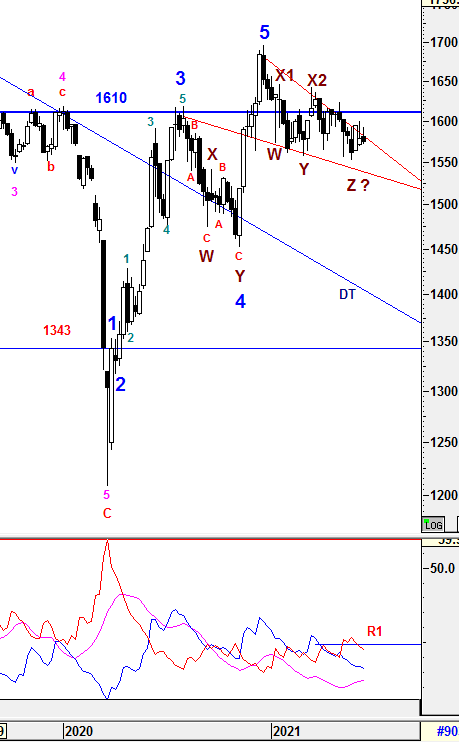
To recap from prior session 61, there was a breakout was attempted but retraced back below the Falling Wedge Pattern (upper red line band). Therefore, a short term consolidation required within the Wedge's band before a true breakout emerged. However, 1610 is still the level to watch for longer run.
{{{{{{{{{{{{{{{{{{{{{{{{{{
For the past 1 week, an breakout had been attempted again on the Falling Wedge Pattern (upper red line band). To reiterate, a short term consolidation is still require within the Wedge's band before a true breakout emerged. However, 1610 is still the level to watch for longer run.
}}}}}}}}}}}}}}}}}}}}}}}}}}
From wave count perspective, the Higher Degree of Correction wave would be prolong with Multiple WXYXZ complex waves before a new set of Higher Degree of Bull Wave take place. Subsequent minor waves would be elaborated further in daily time frame.
1) -DMI (red line) still heading down with lower margin indicates bear strenght is still decreasing will lower margin and maintain below R1 indicates bearish sentiment could be reduced further for a week.
2) +DMI (blue line) still heading down with greater margin indicates bull strenght is decreasing with greater pace and not in favor yet.
3) ADX (pink line) still heading up with consistent margin implying that the volatility of the current trend is still increasing but still low.
Therefore, the summations of the 3 signals above is still implying Bear strength is still in favor. However , +DMI is still below -DMI lines with consistent spread which indicating the Bear strength is still in favor with consistent volitality. This indicates that weakness may still emerging and consolidating expected in coming weeks. The current volatility is improving but still low and continuous rise in ADX reading would justify a prominent uptrend to be developed.
Prevailing trend could be emerged if Weekly levels listed below was broken:
Resistance - 1627, 1633, 1642, 1650, 1700, 1720
Immediate Resistance - 1585, 1588, 1595, 1600, 1610, 1615, 1619
Immediate Support - 1575-1577, 1570, 1564
Support - 1556, 1541, 1530, 1510, 1500
Daily Time Frame
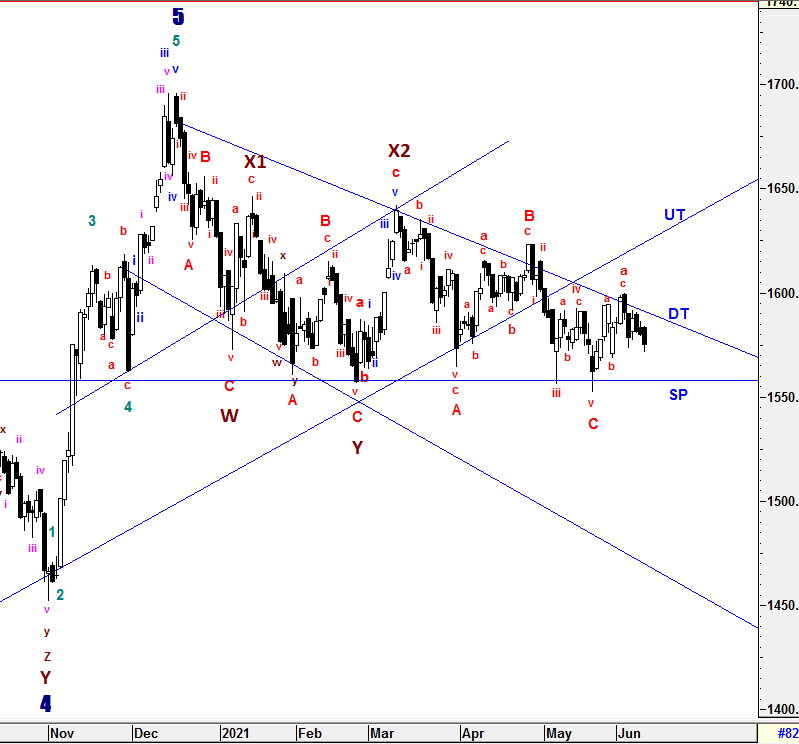
To recap from session 61, I had yet to conclude that Complex Waves had emerged since DT and UT line had yet to be penetraded to the upside or 1568.47 breached to the lower end which would threaten the SP line support level (1557). Therefore, target of Wave Z is still being monitored closely. Above all, i was expecting a short term consolidation emerged before a clear signal was triggered.
{{{{{{{{{{{{{{{{{{{{{{{{{{
For the past 1 week, KLCI is still being resisted at DT line and weakening. Besides that, there is high probability for Wave Z to be prolong as more minuette corrective waves emerged due to momentum change. After wave C realized at 1552.07, sub minuette wave a had been formed and sub minuette wave b is underway where the recent low have almost met the minimum criteria level of FIBO 61.8% at 1570 currently. However, i won't rule out that sub minuette wave b could end lower in between FIBO region of 61.8 - 100% (1570 - 1552). No doubt that i am still expecting a longer consolidation phase emerged before a clear signal to be seen.
}}}}}}}}}}}}}}}}}}}}}}}}}}
To reiterate, Wave Z could be formed in various correctives wave structure (Zig-Zag, Flat, Diagonal and etc) with momentum changes.
Since Multiple Complex Wave emerged, the new set of Higher Degree of 5 Waves Bull Run or Primary Wave 3 have yet to be seen until all corrective waves are served convicingly. Thus, Higher Degree of Correction is still being prolong by these Multiple Complex Waves WXYXZ.
The entire wave structures will still be monitored closely if the high of Wave X1 (1646.24) is penetraded which indicates Higher Degree of implusive Wave 1 could have emerged.
All waves' count and projected target are generated based on past/current price level and it may be subjected to vary if degree of momentum movement change.
Prevailing trend could be emerged if Daily levels listed below was broken:
Resistance - 1615, 1620, 1625-1628, 1639, 1645, 1650, 1662, 1679, 1685, 1700, 1720
Immediate resistance - 1578, 1581, 1588, 1590, 1595-1597, 1600, 1608-1610
Immediate Support - 1570, 1562-63, 1556-1551, 1538-1545
Support - 1530, 1518, 1500
==================================================================================
Patient is required for the SUPER CYCLE Bull Run.
==================================================================================
Let's Mr Market pave the waves.
Trade safely
Wave Believer
More articles on KLCI waves
KLCI waves 94 - WILL THE DOWNWARD PRESSURE TO BE IMPULSIVE TOWARDS WAVE E?
Created by hotstock1975 | Jan 24, 2022
KLCI waves 93 - EXTENSION UPWARD ENDED AND IT'S TIME TO THE DOWNSIDE?
Created by hotstock1975 | Jan 17, 2022
KLCI waves 89 - KLCI WILL EXTEND AND HIT LOWER TARGETS GRADUALLY
Created by hotstock1975 | Dec 20, 2021
Featured Posts
Introducing MY's First IPO Fund for Sophisticated Investors!
New Update. Discover investment communities that resonate with your ideas
M & A Value Partners IPO Equity Fund has been launched - Targeted 13% Return p.a
Latest Videos


Apps


Top Articles
1
The Alpha Trader
3
Rakuten Trade Research Reports
4
南洋行家论股
7
TA Sector Research
8
BFM Podcast
#
Stock
Score
Daily Stocks
Stock Name
Last
Change
Volume
Stock Name
Last
Change
Volume
Stock Name
Last
Change
Volume
MQ Trading Signals
Stock
Time
Signal
Duration
Stock
Time
Signal
Duration
Featured Advertisers / Partners


Ride The Bull Short The Bear
CS Tan
4.9 / 5.0
This book is the result of the author's many years of experience and observation throughout his 26 years in the stockbroking industry. It was written for general public to learn to invest based on facts and not on fantasies or hearsay....