Weekly Time Frame
To recap from prior session 63, i would still be cautious unless 1595 was cleared in order to test the next significant level of 1610 where a true breakout was justified even an breakout attempt was successful from the Falling Wedge Pattern (upper red line band).
{{{{{{{{{{{{{{{{{{{{{{{{{{
For the past 1 week, KLCI had returned back down to Falling Wedge Pattern's band due to weak sentiment evolved. The critical support of 1556 had been threathen to break to the down side which possible targeted near the lower band of Falling Wedge Pattern at around 1535. Unless, it could move back up above 1590 to stay on course to the upside.
}}}}}}}}}}}}}}}}}}}}}}}}}}
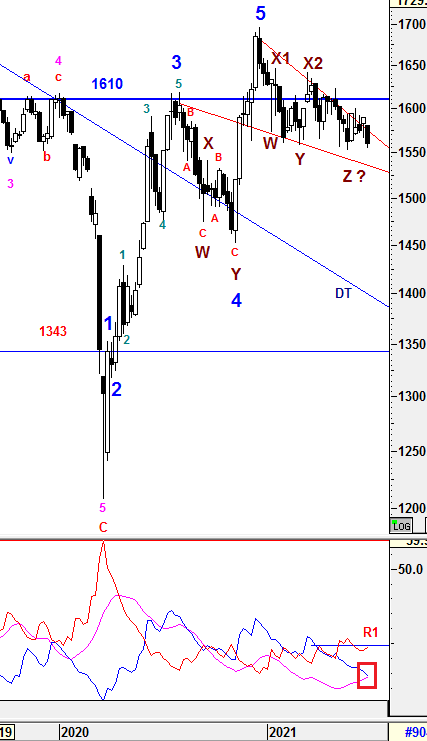
From wave count perspective, the Higher Degree of Correction wave would be prolong with Multiple WXYXZ complex waves before a new set of Higher Degree of Bull Wave take place. Subsequent minor waves would be elaborated further in daily time frame.
1) -DMI (red line) curved up with greater margin indicates bear strenght is still increasing will higher pace and bearish momentum will increase further if R1 is penetraded.
2) +DMI (blue line) still heading down with greater margin indicates bull strenght is decreasing with greater pace and not in favor yet.
3) ADX (pink line) still heading up with greater margin implying that the volatility of the current trend is still increasing with good pace but still consider low.
Therefore, the summations of the 3 signals above is still implying Bear strength is still in favor. However, +DMI is still below -DMI lines with increasing spread which indicating the Bear strength is still in favor with increasing volitality. This indicates that weakness may still emerging and consolidating expected in coming weeks. The current volatility is still improving and continuous rise in ADX reading would justify a prominent uptrend to be developed. There can be a potential criss-cross event in between +DMI and ADX which indicates an strong bear signal ahead if the selling pressure continue.
Prevailing trend could be emerged if Weekly levels listed below was broken:
Resistance - 1627, 1633, 1642, 1650, 1700, 1720
Immediate Resistance - 1564, 1571, 1575-78, 1590, 1595, 1600, 1610, 1615, 1619
Immediate Support - 1556, 1541, 1530
Support - 1510, 1500, 1490, 1466, 1452
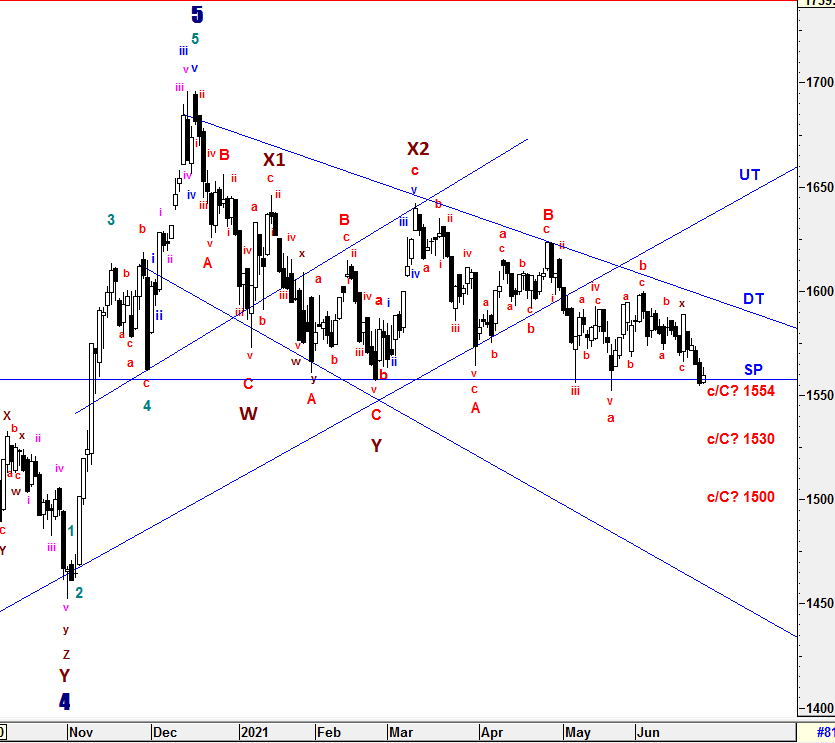
To recap from session 63, sub minuette wave b ended at 1565.74 and sub minuette wave c was underway which was bias to the upside. Therefore, i was expecting that any upside could be shortlive towards revised DT line unless there was a formidable breakout above 1600 which supported by continuous Rotation Sector Play. Above all, i was still seeing a longer consolidation phase emerged before a clear signal to be seen.
{{{{{{{{{{{{{{{{{{{{{{{{{{
For the past 1 week, the momentum continue to be weak and pull back emerged to prolong the consolidation further. Due to momentum change, there was an minuette complex wave x ended at 1589.05 emerged. Therefore, wave C, which was quoted at 1552.07, has been revised to be sub minuette wave a and sub minuette wave b ended at 1599.72 as shown. Currently, sub minuette wave c, contain minuette complex wave x, is still being constructed and has met its minimum criteria of FIBO 61.8% at low of 1554.15. However, i won't rule out that it could test at lower level of FIBO region of 61.8 - 100% (1556 - 1530) or even DIAMOND FORMATION target at 1500.Unless, KLCI could reverse up above 1600 or DT line in order to building up upside momentum for longer bull run.
As expected, a prolong corrective waves will prolong Wave Z since wave C is still yet to be justified.
}}}}}}}}}}}}}}}}}}}}}}}}}}
To reiterate, Wave Z could be formed in various correctives wave structure (Zig-Zag, Flat, Diagonal and etc) with momentum changes.
Since Multiple Complex Wave emerged, the new set of Higher Degree of 5 Waves Bull Run or Primary Wave 3 have yet to be seen until all corrective waves are served convicingly. Thus, Higher Degree of Correction is still being prolong by these Multiple Complex Waves WXYXZ.
The entire wave structures will still be monitored closely if the high of Wave X1 (1646.24) is penetraded which indicates Higher Degree of implusive Wave 1 could have emerged.
All waves' count and projected target are generated based on past/current price level and it may be subjected to vary if degree of momentum movement change.
Prevailing trend could be emerged if Daily levels listed below was broken:
Resistance - 1615, 1620, 1625-1628, 1639, 1645, 1650, 1662, 1679, 1685, 1700, 1720
Immediate resistance - 1562-63, 1570, 1578, 1583, 1588, 1590, 1595-1598, 1600, 1608-1610
Immediate Support - 1556-1551, 1538-1545, 1530
Support - 1518, 1500, 1490, 1461
==================================================================================
Patient is required for the SUPER CYCLE Bull Run.
==================================================================================
Let's Mr Market pave the waves.
Trade safely
Wave Believer


hotstock1975
KLCI have entered in the FIBO region of 61.8 - 100 % as mentioned and its hovering at around 78.6% currently. Let's see whether it would extend to 1500 (Diamond Formation target) or FIBO 161.8% at 1484.
2021-06-29 11:30