Monthly Time Frame
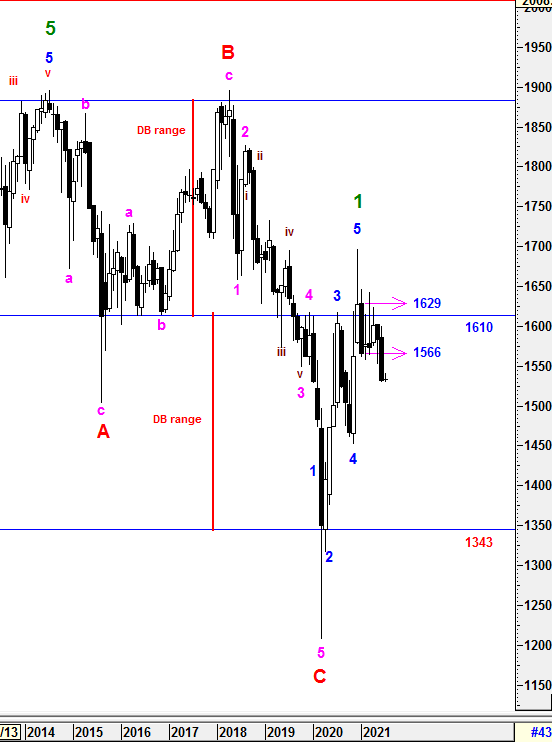
To recap from session 61, KLCI had moved in a tight range and still consolidating within Engulfing Formation 1566.4 - 1629. No doubt that we were will still prefer KLCI would sustain good closing above 1610 for coming few months in order to setup a stronger foothold to the upside for longer run which could overwrite the Double Top Formation (DB range).
{{{{{{{{{{{{{{{{{{{{{{{{{{
For the past 1 month, weakness continued and breakout from Bearish Engulfing Range to the downside. It has realized the Bearish Engulfing Formation, which had formed on Dec-Jan 2021, and indicates weaknesses would continue for months. Therefore, i will still cautious unless there is an reversal signal which could lead the momentum to penetrade above 1610 to the upside.
}}}}}}}}}}}}}}}}}}}}}}}}}}
On wave counts perspective, Primary Wave 1 could be formed after 5 Higher Degree of Impulsive Bull Waves had been structured from March to Dec 2020. No doubt that Primary Wave 2 correction is underway which expected to be a prolong waves unless a unknown catalyst emerged to re-write the extension waves within. Therefore, smaller time frame would be monitor closely for any unexpected waves incurred. Subsequent minor waves would be elaborated further in daily time frame.
To reiterate, the Double Top Formation (DB range) structure formed in between July 2014 and April 2018 could be overwritten by Primary Wave 3 Bull Run when Primary Wave 2 Correction end.
The new Super Cycle Bull Wave is still valid and expecting some knee jerk reactions along the prolong cycle.
Prevailing trend could be emerged if Monthly levels listed below was broken:
Resistance : 1566, 1573, 1610
Support : 1525-1530, 1504-1500, 1465
Weekly Time Frame
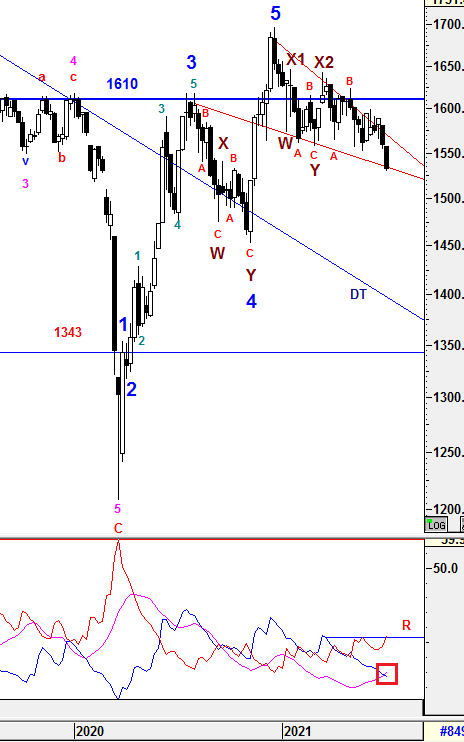
To recap from prior session 64, had returned back down to Falling Wedge Pattern's band due to weak sentiment evolved. The critical support of 1556 had been threathen to break to the down side which possible targeted near the lower band of Falling Wedge Pattern at around 1535. Unless, it could move back up above 1590 to stay on course to the upside.
{{{{{{{{{{{{{{{{{{{{{{{{{{
For the past 1 week, selling pressure emerging which lead KLCI to breach the critical support of 1556 and closed at 1533.35 which is around the lower band of Falling Wedge Pattern. Would this lower band level act as support for any possible rebound? Let's see whether 1530 can be sustained before any clear signal emerge.
TREND indicators
1) -DMI (red line) still heading up with consistent margin indicates bear strenght is still increasing will consistent pace and bearish momentum will increase further since R is penetraded.
2) +DMI (blue line) still heading down with consistent margin indicates bull strenght is decreasing with consistent pace and not in favor yet.
3) ADX (pink line) still heading up with consistent margin implying that the volatility of the current trend is still increasing with consistent pace and improving.
Therefore, the summations of the 3 signals above is still implying Bear strength is still in favor. However, +DMI is still below -DMI lines with increasing spread which indicating the Bear strength is still in favor with increasing volitality. Besides that, ADX has crossed above +DMI indicates an bear momentum might continue. This indicates that weakness may still emerging and further consolidating expected in coming weeks. The current volatility is still improving and continuous rise in ADX reading would justify a Bearish trend to be developed.
}}}}}}}}}}}}}}}}}}}}}}}}}}
From wave count perspective, the Higher Degree of Correction wave would be prolong with Multiple WXYXZ complex waves before a new set of Higher Degree of Bull Wave take place. Subsequent minor waves would be elaborated further in daily time frame.
Prevailing trend could be emerged if Weekly levels listed below was broken:
Resistance - 1627, 1633, 1642, 1650, 1700, 1720
Immediate Resistance - 1541, 1556, 1564, 1571, 1575-78, 1590, 1595, 1600, 1610, 1615, 1619
Immediate Support - 1530, 1519-1521, 1510
Support - 1500, 1490, 1466, 1452
Daily Time Frame
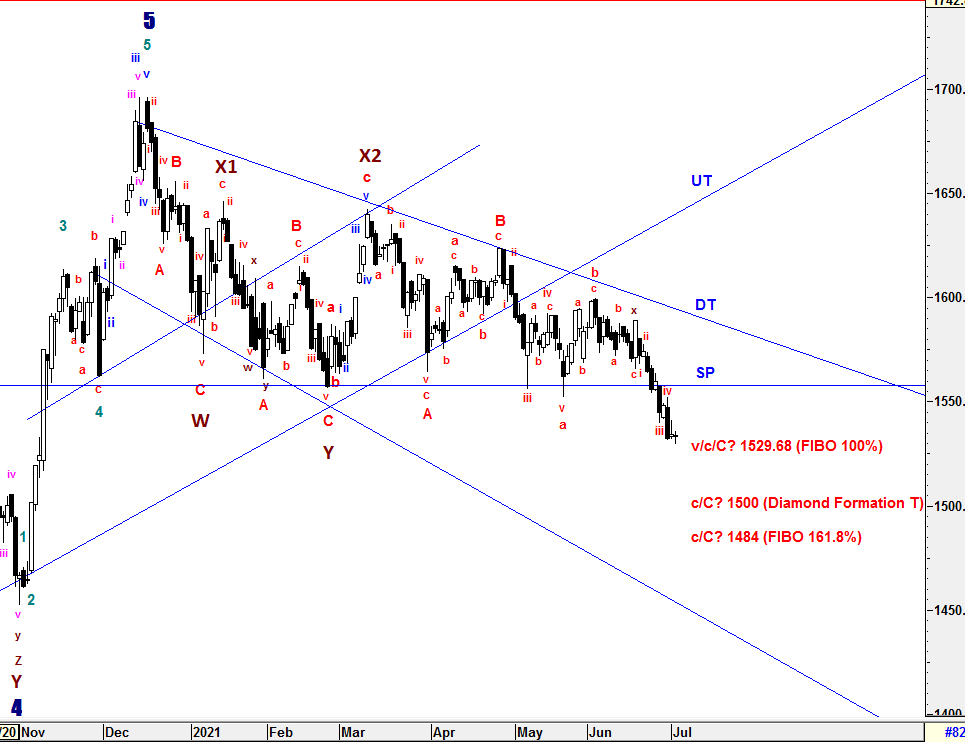
To recap from session 64, the revised sub minuette wave c, which contain sub minuette complex wave x, was still being constructed and had met its minimum criteria of FIBO 61.8% at low of 1554.15. However, i won't rule out that it could test at lower level of FIBO region of 61.8 - 100% (1556 - 1530) or even DIAMOND FORMATION target at 1500.
{{{{{{{{{{{{{{{{{{{{{{{{{{
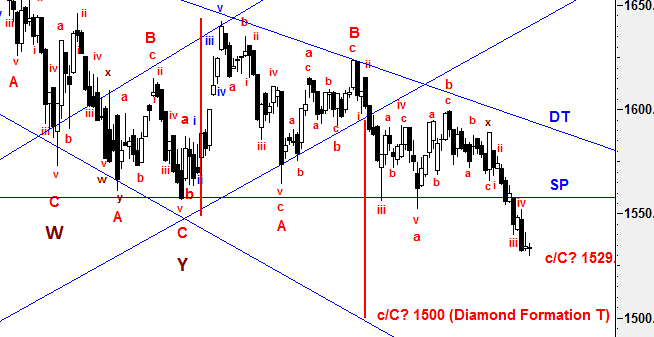
For the past 1 week, no doubt that KLCI went further down to hit FIBO 100% at 1529.68 due to continuous weaknesses emerged. As mentioned in my daily update, 5 sub minuette waves i-ii-iii-iv-v structure has been formed after sub minuette complex wave x. Since it has met FIBO 100% criteria, shall i call wave c/C ended here? If the selling pressure continue, i won't rule out that it would end lower at 1484 (FIBO 161.8%) with sub minuette waves extension or the DIAMOND FORMATION target at around 1500 (As per Diagram below) since SP line had been breached. Unless there is an strong rebound emerge that could initiate KLCI back above SP line which could justify the end of wave c/C. However, i would still be very cautious on any rebound which could be shortlive since weak momentum indicated in Monthly and Weekly Time Frame.
Diamond Formation Diagram
As expected, a prolong corrective waves will prolong Wave Z since wave C is still yet to be justified.
}}}}}}}}}}}}}}}}}}}}}}}}}}
To reiterate, Wave Z could be formed in various correctives wave structure (Zig-Zag, Flat, Diagonal and etc) with momentum changes.
Since Multiple Complex Wave emerged, the new set of Higher Degree of 5 Waves Bull Run or Primary Wave 3 have yet to be seen until all corrective waves are served convicingly. Thus, Higher Degree of Correction is still being prolong by these Multiple Complex Waves WXYXZ.
The entire wave structures will still be monitored closely if the high of Wave X1 (1646.24) is penetraded which indicates Higher Degree of implusive Wave 1 could have emerged.
All waves' count and projected target are generated based on past/current price level and it may be subjected to vary if degree of momentum movement change.
Prevailing trend could be emerged if Daily levels listed below was broken:
Resistance - 1595-1598, 1600, 1608-1610, 1615, 1620, 1625-1628, 1639, 1645, 1650, 1662, 1679, 1685, 1700, 1720
Immediate resistance - 1540, 1544-1548, 1556-1560, 1562-63, 1570, 1578, 1583, 1588, 1590
Immediate Support - 1530, 1525, 1518
Support - 1500, 1490, 1461
==================================================================================
Patient is required for the SUPER CYCLE Bull Run.
=================================================================================
Let's Mr Market pave the waves.
Trade safely
Wave Believer


.png)


hotstock1975
Since the prior low of 1529.68 has been breached, i am seeing 3rd sub minuette waves extension (iii) is not over yet which could lead to lower level. Moreover, weekly DMI spread continue to expand widely with rising ADX which indicates more downside may come unless a there is unexpected catalyst to turn things around for reversal. Finger cross.
2021-07-07 12:09