Weekly Time Frame
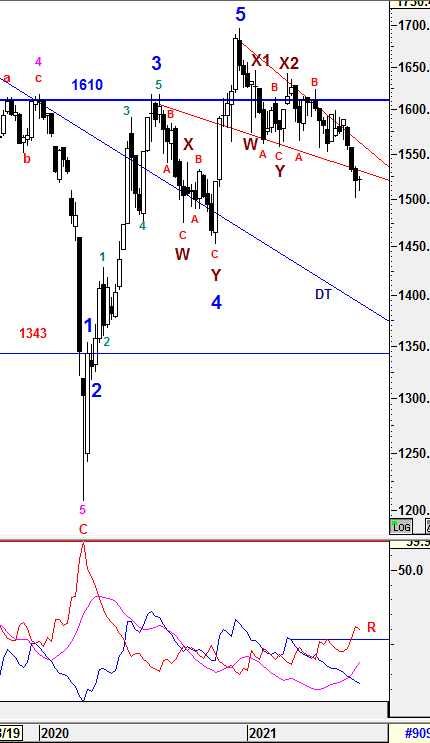
To recap from prior session 66, 1530 was failed to hold and breached which failing the Falling Wedge Pattern as shown and rebounded off after hit 1501. I was expecting there would be consolidation above the psychological level of 1500 before a clear signal emerge whether the rebound could be sustainable. 1535 was the key level to watch for any possible trend reversal event.
{{{{{{{{{{{{{{{{{{{{{{{{{{{{{{{{{{{{{{{{{{{{{{{{{{{{
For the past 1 week, KLCI has consolidated above 1500 as expected and formed an Doji instead of Hammer as the tail was too short. These has indicated the selling pressure has halt at these level and pending for further catalyst to go either side. Therefore, the key levels to watch are 1530-1535 and 1500 where momentum would be triggered if either levels are penetraded or breached. However, i am expecting the consolidation will end soon with more clearer signal to be seen by next week.
TREND indicators
1) -DMI (red line) still curved down with lower margin indicates bear strenght is decreasing will lower pace and bearish momentum will might continue since -DMI is still above R line.
2) +DMI (blue line) still heading down with lower margin indicates bull strenght is decreasing with lower pace and not in favor yet.
3) ADX (pink line) still heading up with consistent margin implying that the volatility of the current trend is still increasing with consistent pace and improving.
Therefore, the summations of the 3 signals above is still implying Bear strength is still in favor. +DMI is still below -DMI lines with decreasing spread which indicating the Bear strength is taking a breath but still in favor with increasing volitality. Since ADX has crossed above +DMI for 3 weeks consistently, it indicates the bear momentum might continue and weakness may still emerging and further consolidating expected in coming weeks. If-DMI continue to raise consistenly and ADX reading raise above 20, we could see current rebound would be shortlive and weakness is still ahead unless KLCI could close above 1530-1535 after consolidation phase in coming weeks to justify a reversal trend to be developed.
}}}}}}}}}}}}}}}}}}}}}}}}}}}}}}}}}}}}}}}}}}}}}}}}}}}}
From wave count perspective, the Higher Degree of Correction wave would be prolong with Multiple WXYXZ complex waves before a new set of Higher Degree of Bull Wave take place. Subsequent minor waves would be elaborated further in daily time frame.
Prevailing trend could be emerged if Weekly levels listed below was broken:
Resistance - 1610, 1615, 1619 , 27, 1633, 1642, 1650, 1700, 1720
Immediate Resistance - 1530, 1535, 1541, 1556, 1564, 1571, 1575-78, 1590, 1595, 1600
Immediate Support - 1521, 1510, 1500, 1490, 1484
Support - 1466, 1452, 1447, 1436, 1407
Daily Time Frame
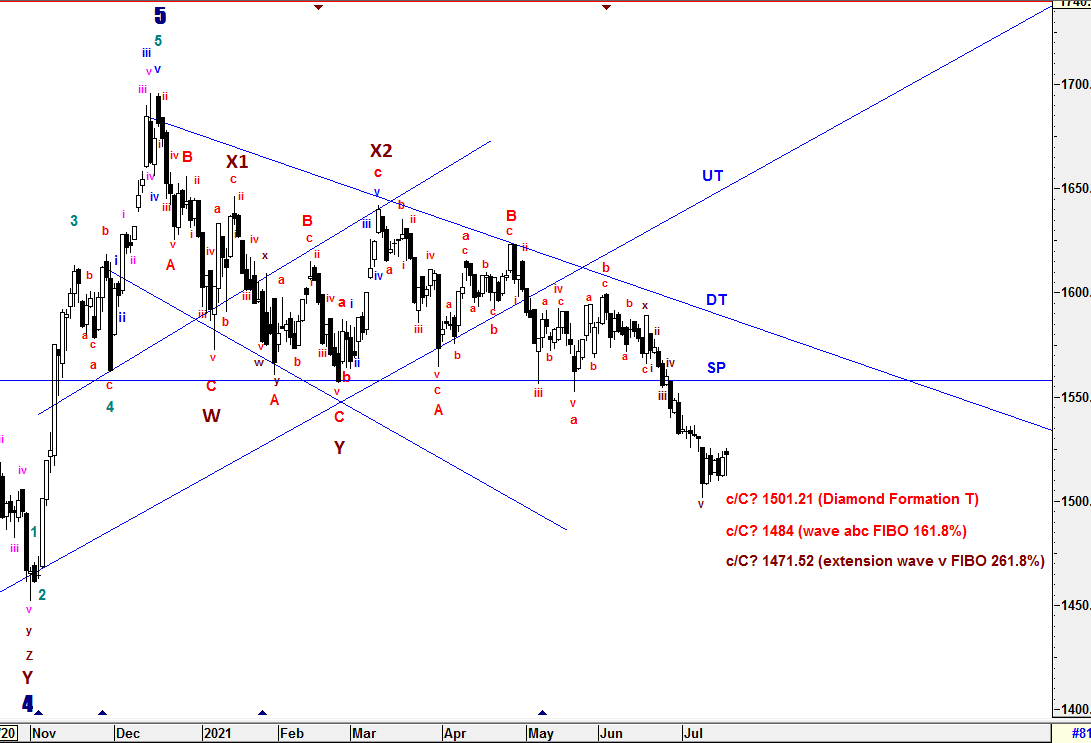
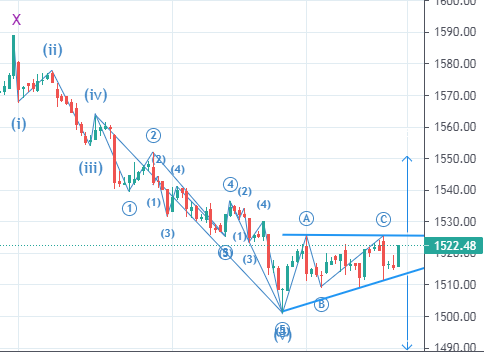
To recap from session 66, the sold off continued after the immediate support of 1530 breached and hit as low as 1501.21 which met the criteria of the DIAMOND FORMATION target at around 1500 (Diagram labelled at Session 65). The sub minuette wave v extension incurred and end at 1501.21 which met the sub minuette extension criteria of FIBO 161.8% to complete the entire sub minuette wave (i)-(ii)-(iii)-(iv)-1-2-3-4-5 (v) as labelled in the diagram below. Although one of the criteria met, i won't rule out that the sub minuette wave v extension could end furhter down to meet the level of FIBO 261.8% (1471.52) or sub minuette wave c's FIBO 161.8% (1484) if the selling pressure continued. Unless KLCI could raise above 1552.07 to justify the end of wave c/C from now after consolidaiton phase.
{{{{{{{{{{{{{{{{{{{{{{{{{{{{{{{{{{{{{{{{{{{{{{{{{{{{
For the past one week, KLCI has consolidated as expected and tight range has been formed in between 1510-1525. These range had been structured as an Ascending Triangle Pattern which indicated bottoming could have emerged and bias to the upsides in short run. If breakout above 1525 incurred, the momentum could lead KLCI to the level around 1550 technically and raise above 1552.07 to justify the end of wave c/C. Besides that, 1530-1535 is still the level to watch whether the pattern breakout could be sustainable. However, i will still be very caution as the Ascending Triangle Pattern could be the continuous trend to the downside at around 1490 technically if 1512 breached. As long as the current Daily & Weekly indications are still bearish, i will assume the current the consolidaiton pattern as sub minuette wave a-b-c of the sub minuette extension wave (As Diagram Below) which the prior extension wave to be extended futher to the downside. Therefore, both indicated downside target are still valid if Ascending Triangle Pattern breakdown emerged.
As expected, a prolong corrective waves will prolong Wave Z since wave C is still yet to be justified.
To reiterate, Wave Z could be formed in various correctives wave structure (Zig-Zag, Flat, Diagonal and etc) with momentum changes.
}}}}}}}}}}}}}}}}}}}}}}}}}}}}}}}}}}}}}}}}}}}}}}}}}}}}
Since Multiple Complex Wave emerged, the new set of Higher Degree of 5 Waves Bull Run or Primary Wave 3 have yet to be seen until all corrective waves are served convicingly. Thus, Higher Degree of Correction is still being prolong by these Multiple Complex Waves WXYXZ.
The entire wave structures will still be monitored closely if the high of Wave X1 (1646.24) is penetraded which indicates Higher Degree of implusive Wave 1 could have emerged.
All waves' count and projected target are generated based on past/current price level and it may be subjected to vary if degree of momentum movement change.
Prevailing trend could be emerged if Daily levels listed below was broken:
Resistance - 1595-1598, 1600, 1608-1610, 1615, 1620, 1625-1628, 1639, 1645, 1650, 1662, 1679, 1685, 1700, 1720
Immediate resistance - 1526, 1530, 1535, 1540, 1544-1548, 1556-1560, 1562-63, 1570, 1578, 1583, 1588, 1590
Immediate Support - 1518, 1512, 1500, 1490
Support - 1475, 1461-1466, 1452, 1435
==================================================================================
Patient is required for the SUPER CYCLE Bull Run.
=================================================================================
Let's Mr Market pave the waves.
Trade safely
Wave Believer