


Let's Mr Market pave the waves.
Trade safely
Wave Believer

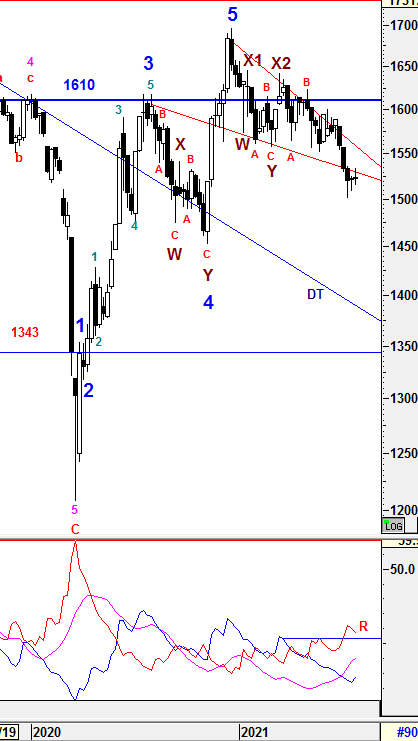
Weekly Time Frame
To recap from prior session 67, KLCI had consolidated above 1500 as expected and formed an Doji instead of Hammer as the tail was too short. These had indicated the selling pressure had halt at these level and pending for further catalyst to go either side. Therefore, the key levels to watch are 1530-1535 and 1500 where momentum would be triggered if either levels are penetrated or breached. However, i was expecting the consolidation will end soon with more clearer signal to be seen by next week.
{{{{{{{{{{{{{{{{{{{{{{{{{{{{{{{{{{{{{{{{{{{{{{{{{{{{
For the past 1 week, uncertainty was still playing a major role to halt any momentum either side as the attempt to penetrate the range of 1530-1535 was failed and returned to consolidation range. However, I am still expecting there would be a swift attempt which could justify an formidable trend either side. Therefore, the key levels to watch are 1530-1535 and 1515.
TREND indicators
1) -DMI (red line) continue to curve down with consistent margin indicates bear strength is decreasing will consistent pace BUT bearish momentum might continue since -DMI is still above R line.
2) +DMI (blue line) curved up with greater margin indicates bull strength is increasing with greater pace BUT not in favor yet.
3) ADX (pink line) still heading up with lower margin implying that the volatility of the current trend is still increasing with lower pace.
Therefore, the summations of the 3 signals above is still implying Bear strength is still in favor. +DMI is still below -DMI lines with decreasing spread which indicating the Bear strength is taking a breath but still in favor with increasing volatility. Since ADX has crossed above +DMI for 4 weeks consistently, it indicates the bear momentum might continue and weakness may still emerging for further consolidating expected in coming weeks. With ADX reading has raised above 20 but -DMI curve down, it indicates bearish momentum has yet to be diminished and weakness is still ahead unless KLCI could close above 1530-1535 after consolidation phase in coming weeks to justify a reversal trend to be developed.
}}}}}}}}}}}}}}}}}}}}}}}}}}}}}}}}}}}}}}}}}}}}}}}}}}}}
From wave count perspective, the Higher Degree of Correction wave would be prolong with Multiple WXYXZ complex waves before a new set of Higher Degree of Bull Wave take place. Subsequent minor waves would be elaborated further in daily time frame.
Prevailing trend could be emerged if Weekly levels listed below was broken:
Resistance - 1610, 1615, 1619 , 27, 1633, 1642, 1650, 1700, 1720
Immediate Resistance - 1530, 1535, 1541, 1556, 1564, 1571, 1575-78, 1590, 1595, 1600
Immediate Support - 1522, 1510, 1500, 1490, 1484
Support - 1466, 1452, 1447, 1436, 1407
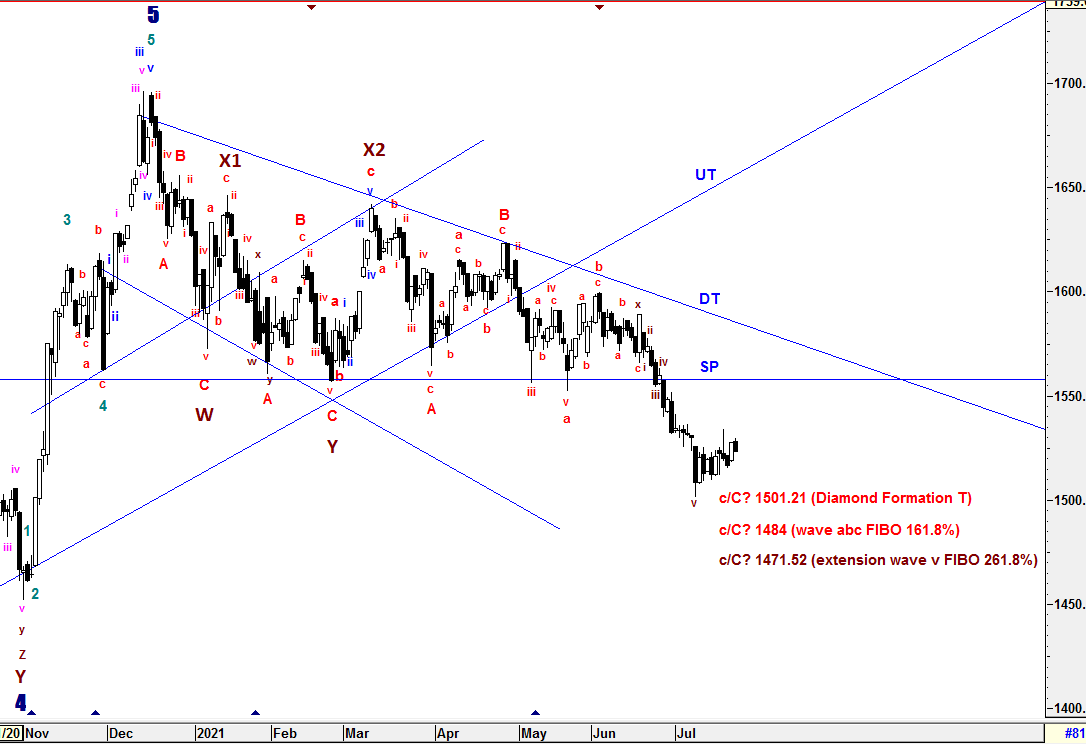
Daily Time Frame
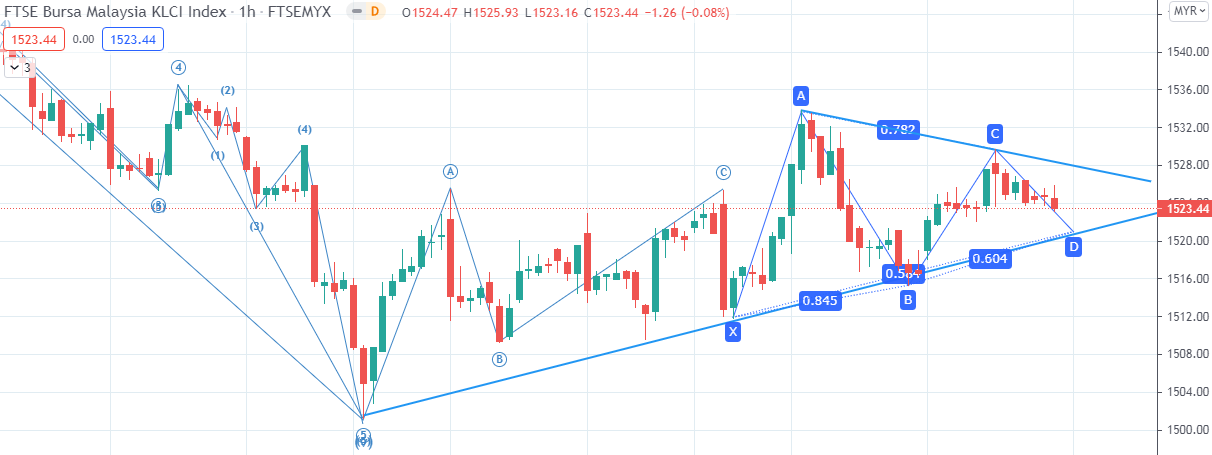
To recap from session 67, KLCI had consolidated as expected to form an Ascending Triangle Pattern which indicated bottoming could have emerged and bias to the upsides in short run. If breakout above 1525 incurred, the momentum could lead KLCI to the level around 1550 technically BUT 1530-1535 was still the level to watch whether the pattern breakout could be sustainable. Therefore, i would still be very caution as the Ascending Triangle Pattern could be the continuous trend to the downside at around 1490 technically if 1512 breached since the current Daily & Weekly indications were still bearish. I assumed the current the consolidation pattern as sub minuette wave a-b-c of the sub minuette extension wave which the prior extension wave to be extended further to the downside.
{{{{{{{{{{{{{{{{{{{{{{{{{{{{{{{{{{{{{{{{{{{{{{{{{{{{
For the past one week, There was an breakout attempt from the Ascending Triangle Pattern but failed to advance after hitting the resistance range of 1530-1535. In wave count perspective as per downside assumption, an complex wave of sub minuette wave x emerged and a new Symmetrical Triangle Formation has been structure with new sub minuette wave a-b-c. Beside that, wave d is still being structured and would end soon. Once again, an pending formation breakout will initiate an momentum to either side. However, i won't rule out that the breakout would be bias to the downside which could lead to two prior targets as sub minuette wave c's FIBO 161.8% (1484) or sub minuette wave v extension FIBO 261.8% (1471.52). Unless 1530-1535 could be penetrated convincingly, there would be a chance to hit 1550-1553 in order to justify the end of wave c/C.
As expected, a prolong corrective waves will prolong Wave Z since wave C is still yet to be justified.
To reiterate, Wave Z could be formed in various correctives wave structure (Zig-Zag, Flat, Diagonal and etc) with momentum changes.
}}}}}}}}}}}}}}}}}}}}}}}}}}}}}}}}}}}}}}}}}}}}}}}}}}}}
Since Multiple Complex Wave emerged, the new set of Higher Degree of 5 Waves Bull Run or Primary Wave 3 have yet to be seen until all corrective waves are served convincingly. Thus, Higher Degree of Correction is still being prolong by these Multiple Complex Waves WXYXZ.
The entire wave structures will still be monitored closely if the high of Wave X1 (1646.24) is penetrated which indicates Higher Degree of implusive Wave 1 could have emerged.
All waves' count and projected target are generated based on past/current price level and it may be subjected to vary if degree of momentum movement change.
Prevailing trend could be emerged if Daily levels listed below was broken:
Resistance - 1595-1598, 1600, 1608-1610, 1615, 1620, 1625-1628, 1639, 1645, 1650, 1662, 1679, 1685, 1700, 1720
Immediate resistance - 1528. 1530, 1535, 1540, 1544-1548, 1556-1560, 1562-63, 1570, 1578, 1583, 1588, 1590
Immediate Support - 1522.5, 1515, 1512, 1500, 1490
Support - 1475, 1461-1466, 1452, 1435
==================================================================================
Created by hotstock1975 | Jan 24, 2022
Created by hotstock1975 | Jan 17, 2022
Created by hotstock1975 | Dec 20, 2021
After you have put his full name, i just aware of them but not knowing them. Can ask them to share their wave counts here?
2021-07-26 17:17
To be honest, this is only my research on KLCI Analysis to share with public without LURING readers to join some special Telegram or FB group in order for the host to make money. I am welcome everyone to share their thought or knowledge in this well establish platform and learn something new together. Regards. Wave Believer.
2021-07-27 00:25
1
The Alpha Trader
3
南洋行家论股
4
南洋行家论股
5
Rakuten Trade Research Reports
6
TA Sector Research
7
TA Sector Research
#
Stock
Score
Stock Name
Last
Change
Volume
Stock Name
Last
Change
Volume
Stock Name
Last
Change
Volume
Stock
Time
Signal
Duration
Stock
Time
Signal
Duration


CS Tan
4.9 / 5.0
This book is the result of the author's many years of experience and observation throughout his 26 years in the stockbroking industry. It was written for general public to learn to invest based on facts and not on fantasies or hearsay....


cchong86
Do you know cheng hooi?
2021-07-26 11:51