Weekly Time Frame
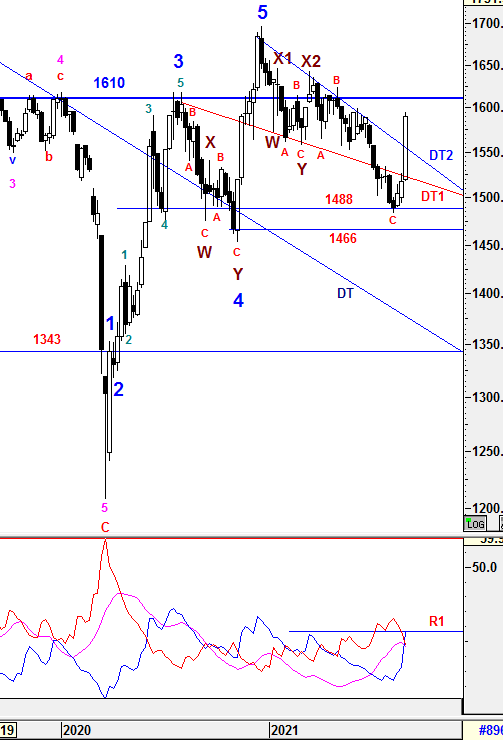
To recap from prior session, the expected upside divergence was able to drive the momentum with improved volume where KLCI was able to close above 1500 for second week at 1518.03. Currently, it was being resisted below DT1 line and 1520-23.
{{{{{{{{{{{{{{{{{{{{{{{{{{{{{{{{{{{{{{{{{{{{{{{{{{{{
For the past 1 week, KLCI had penetrated above DT1 line with greater margin and continuous upside momentum had driven index to close above DT2 line which was the prior upper line of Falling Wedge Formation. Shall the long waited resistance of 1610 be tested again? Let's check the temperature of the current trend.
TREND indicators
1) -DMI (red line) is still heading down with greater margin indicates bear strength is decreasing with greater pace and -DMI has crossed below +DMI for the first time since April 2021.
2) +DMI (blue line) is still heading up with greater margin indicates bull strength is increasing with greater pace and crossed above -DMI indicates BULL is in favor.
3) ADX (pink line) is curving down with increased margin implying that the volatility of the current trend is in slowing pace.
Therefore, the summations of the 3 signals above is still implying Bull strength is in favor. +DMI has crossed above -DMI indicating the Bull strength is still in favor but slower ADX. Although DT1 and DT2 lines has been penetrated with strong momentum, the slower ADX has YET to indicate the current reversal signal is firmed. Therefore, I am still expecting KLCI will consolidate in between the support range of 1562-1600 before a clearer signal emerged. Nevertheless, caution is still required.
}}}}}}}}}}}}}}}}}}}}}}}}}}}}}}}}}}}}}}}}}}}}}}}}}}}}
From wave count perspective, the Higher Degree of Correction wave would be prolong with Multiple WXYXZ complex waves before a new set of Higher Degree of Bull Wave take place. Besides that, wave C has been justified and end at 1483.73 after 1552.07 was penetrated. However, Wave Z is still not been realized yet.
Subsequent minor waves would be elaborated further in daily time frame.
Prevailing trend could be emerged if Weekly levels listed below was broken:
Resistance - 1610, 1615, 1619 , 27, 1633, 1642, 1650, 1700, 1720
Immediate Resistance - 1590, 1595, 1600
Immediate Support - 1580, 1575, 1571, 1564, 1556, 1541, 1535, 1530, 1520-23,1510, 1505, 1500,
Support - 1484-1488, 1474-1476, 1466, 1452, 1447, 1436, 1407
Daily Time Frame
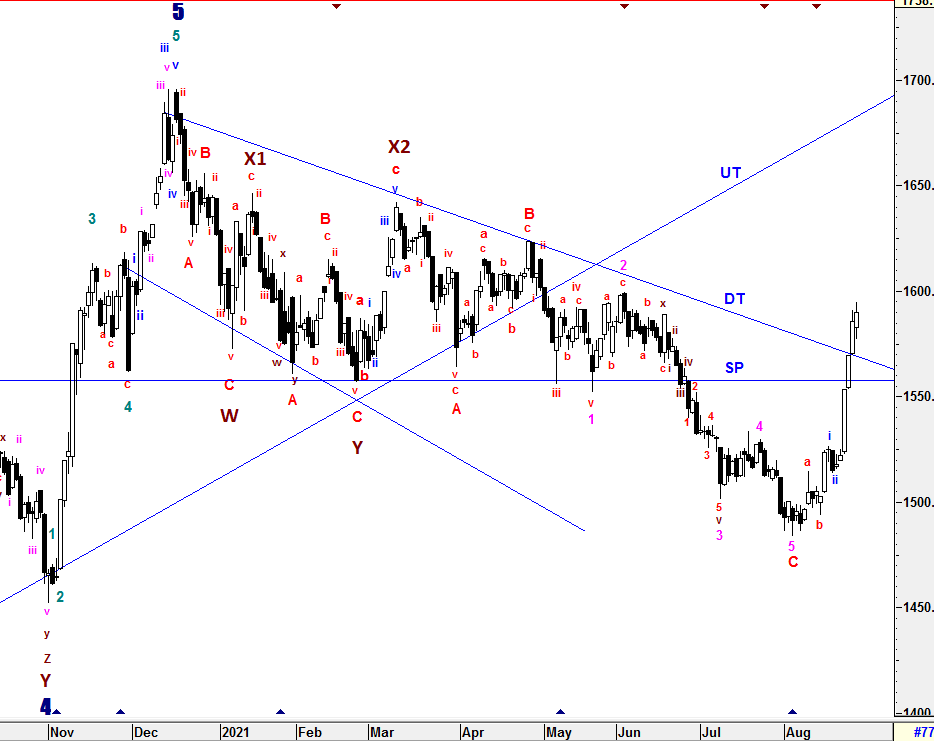
To recap from session 72, the momentum was quite uncertain until 1496.6 has been breached during the construction of complex micro waves z. Therefore, the recent upward momentum from low of 1483.73 was assumed to be corrective waves which formed as sub minuette waves abc. Due to these momentum changes, the entire of wave C structure could be formed in 5 waves structure (1-2-3-4-5) instead of 3 waves (abc) as labelled. That was the reason why i had not justified wave C yet as mentioned in prior session. If this was true, sub minuette wave c target had already met it minimum criteria in conjunction with wave 4 at 1526.34. I won't rule out that it may travel further up to FIBO 50% level (1541) before reversed down to two NEW possible target of wave 5 (1455 or 1440) which could be justified if 1483.73 breached.
{{{{{{{{{{{{{{{{{{{{{{{{{{{{{{{{{{{{{{{{{{{{{{{{{{{{
For the past 1 week, the upward momentum was continued to be strong and traveled beyond FIBO 50% level (1541) to close above SP and DT line. Since 1552.07 was penetrated, wave C structure (1-2-3-4-5) had been revised and shorten where wave 5/wave C to end at 1483.73 as labelled. Besides that, i am still retain the prior revised corrective sub minuette waves a-b-c as there were irregular complex waves formed during sub minuette waves a-b. Therefore, i am Assuming sub minuette waves c could be an extension corrective wave in the form of 3 or 5 waves structure to the upside as labelled.
Although wave C had been justified, i am still leaving Wave Z alone since the assumption of new corrective wave above is yet to be justified.
To reiterate, Wave Z could be formed in various correctives wave structure (Zig-Zag, Flat, Diagonal and etc) with momentum changes.
}}}}}}}}}}}}}}}}}}}}}}}}}}}}}}}}}}}}}}}}}}}}}}}}}}}}
Since Multiple Complex Wave emerged, the new set of Higher Degree of 5 Waves Bull Run or Primary Wave 3 have yet to be seen until all corrective waves are served convincingly unless Wave X1 (1646.24) is penetrated. Thus, Higher Degree of Correction is still being prolong by these Multiple Complex Waves WXYXZ.
All waves' count and projected target are generated based on past/current price level and it may be subjected to vary if degree of momentum movement change.
Prevailing trend could be emerged if Daily levels listed below was broken:
Resistance - 1615, 1620, 1625-1628, 1639, 1645, 1650, 1662, 1679, 1685, 1700, 1720
Immediate resistance - 1595-1598, 1600, 1608-1610
Immediate Support - 1590, 1588, 1583, 1578, 1570, 1562-63, 1556-1560
Support - 1544-1548, 1540, 1535, 1530, 1528, 1525, 1512, 1505, 1500, 1495, 1490, 1484-1488, 1475 , 1461-1466, 1452, 1435
==================================================================================
Patient is required for the SUPER CYCLE Bull Run.
=================================================================================
Let's Mr Market pave the waves.
Trade safely
Wave Believer