Monthly Time Frame
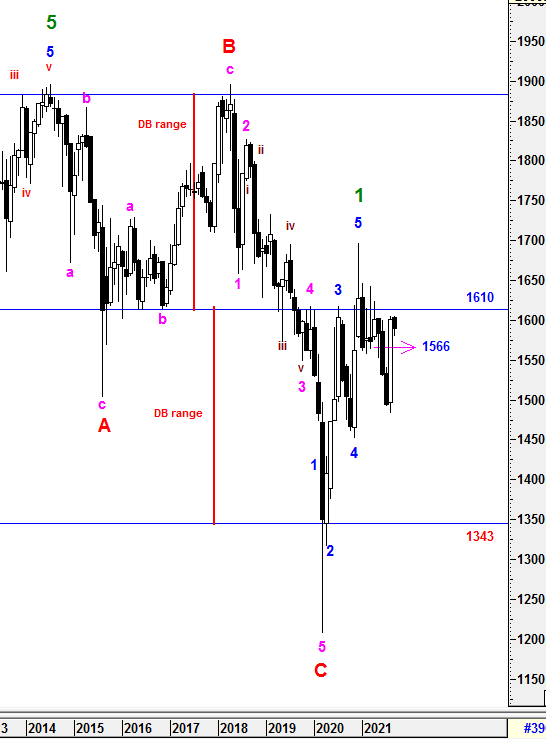
To recap from session 65, weakness continued and breakdown from Bearish Engulfing Range of 1566-1629 to the downside. It had realized the Bearish Engulfing Formation, which had formed on Dec-Jan 2021, and indicated weaknesses would continue for months. Therefore, i would still cautious unless there was an reversal signal which could lead the momentum to penetrate above 1610 to the upside.
{{{{{{{{{{{{{{{{{{{{{{{{{{{{{{{{{{{{{{{{{{{{{{{{{{{{
For the past one month, KLCI was able to rebound strongly and returned above 1566 due to momentum driven by an political catalyst. Can the momentum continue driving KLCI to test and penetrate 1610 again? I am expecting it would consolidating above 1566 before clearer signal emerged.
}}}}}}}}}}}}}}}}}}}}}}}}}}}}}}}}}}}}}}}}}}}}}}}}}}}}
On wave counts perspective, Primary Wave 1 could be formed after 5 Higher Degree of Impulsive Bull Waves had been structured from March to Dec 2020. No doubt that Primary Wave 2 correction is underway which expected to be a prolong waves unless a unknown catalyst emerged to re-write the extension waves within. Therefore, smaller time frame would be monitor closely for any unexpected waves incurred. Subsequent minor waves would be elaborated further in daily time frame.
To reiterate, the Double Top Formation (DB range) structure formed in between July 2014 and April 2018 could be overwritten by Primary Wave 3 Bull Run when Primary Wave 2 Correction end.
The new Super Cycle Bull Wave is still valid and expecting some knee jerk reactions along the prolong cycle.
Prevailing trend could be emerged if Monthly levels listed below was broken:
Resistance : 1601.65, 1610, 1627, 1643
Support : 1573, 1566, 1525-1530, 1504-1500, 1465
Weekly Time Frame
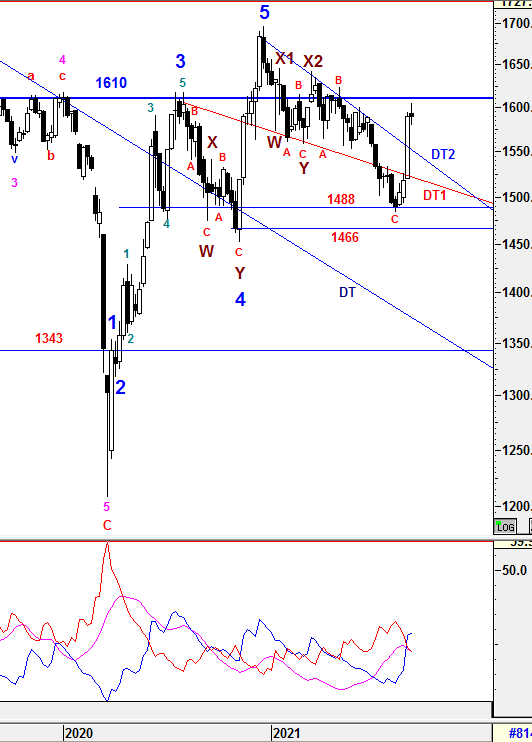
To recap from prior session 73, KLCI had penetrated above DT1 line with greater margin and continuous upside momentum had driven index to close above DT2 line which was the prior upper line of Falling Wedge Formation.
{{{{{{{{{{{{{{{{{{{{{{{{{{{{{{{{{{{{{{{{{{{{{{{{{{{{
For the past one week, the upside momentum had carried forward KLCI to make an attempt to close above 1600 but seems frozen and halted to close at 1589.19. We would see whether the short term consolidation above 1575-1562 can provide stronger foot hole for retesting the long waited resistance of 1610 again? Let's check the temperature of the current trend.
TREND indicators
1) -DMI (red line) is still heading down with lower margin indicates bear strength is decreasing with lower pace.
2) +DMI (blue line) is still heading up with lower margin indicates bull strength is still increasing with lower pace.
3) ADX (pink line) is curving down with consistent margin implying that the volatility of the current trend is in slowing pace.
Therefore, the summations of the 3 signals above is still implying Bull strength is still in favor. +DMI has crossed above -DMI for the second week indicating the Bull strength is still in favor but slower ADX has indicated the current reversal signal is not firmed yet. Therefore, I am still expecting KLCI will continue to consolidate in between the support range of 1562-1600 before a clearer signal emerged. Nevertheless, caution is still required until the barrier of 1610 is cleared.
}}}}}}}}}}}}}}}}}}}}}}}}}}}}}}}}}}}}}}}}}}}}}}}}}}}}
From wave count perspective, the Higher Degree of Correction wave would be prolong with Multiple WXYXZ complex waves before a new set of Higher Degree of Bull Wave take place. Besides that, wave C has been justified and end at 1483.73 after 1552.07 was penetrated. However, Wave Z is still not been realized yet. Subsequent minor waves would be elaborated further in daily time frame.
Prevailing trend could be emerged if Weekly levels listed below was broken:
Resistance - 1610, 1615, 1619, 1627, 1633, 1642, 1650, 1700, 1720
Immediate Resistance - 1590, 1595, 1600
Immediate Support - 1580, 1575, 1571, 1564, 1556, 1541, 1535, 1530, 1520-23,1510, 1505, 1500,
Support - 1484-1488, 1474-1476, 1466, 1452, 1447, 1436, 1407
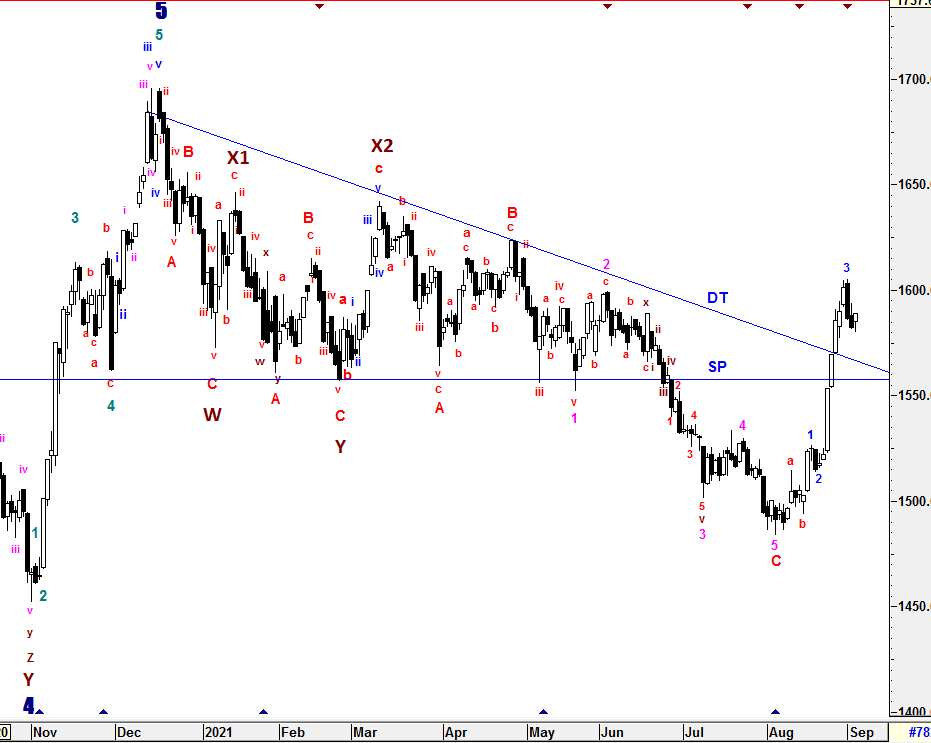
Daily Time Frame
To recap from session 73, the upward momentum was continued to be strong and traveled beyond FIBO 50% level (1541) to close above SP and DT line. Since 1552.07 was penetrated, wave C structure (1-2-3-4-5) had been revised and shorten where wave 5/wave C to end at 1483.73 as labelled. Besides that, i was still retain the prior revised corrective sub minuette waves a-b-c as there were irregular complex waves formed during sub minuette waves a-b. Therefore, i was Assuming sub minuette waves c could be an extension corrective wave in the form of 3 or 5 waves structure to the upside as labelled.
{{{{{{{{{{{{{{{{{{{{{{{{{{{{{{{{{{{{{{{{{{{{{{{{{{{{
For the past one week, KLCI had failed to stay above 1600 and pulled back which created an Bearish Engulfing Candle Formation and realized immediately the following day. Therefore, downward pressure might emerged in coming days to lower level. With my wave count assumption, extension of sub minuette waves c is still underway with 5 waves structure where micro sub minuette waves 3 has been completed and micro sub minuette waves 4 is being structured with a possible target of 1559 (FIBO 50%) or 1548 (FIBO 61.8%). On the other hand, i won't rule out that the extension's momentum could still lead KLCI for further upside before a greater pull back emerged EVEN DT and SP line were penetrated last week.
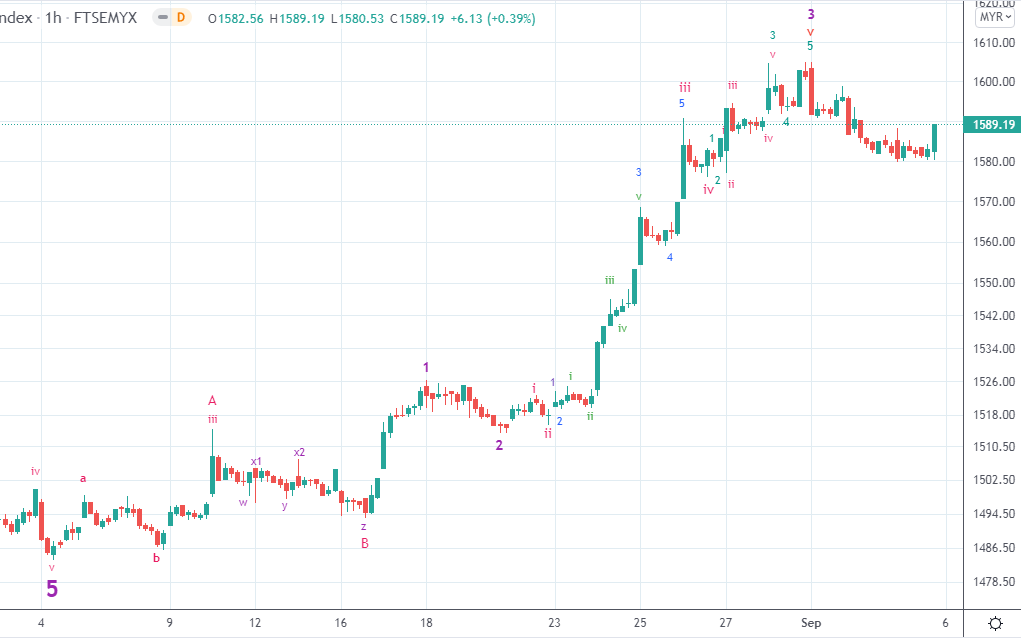
Although wave C had been justified, i am still leaving Wave Z alone since the assumption of new corrective wave above is yet to be justified.
To reiterate, Wave Z could be formed in various correctives wave structure (Zig-Zag, Flat, Diagonal and etc) with momentum changes.
}}}}}}}}}}}}}}}}}}}}}}}}}}}}}}}}}}}}}}}}}}}}}}}}}}}}
Since Multiple Complex Wave emerged, the new set of Higher Degree of 5 Waves Bull Run or Primary Wave 3 have yet to be seen until all corrective waves are served convincingly unless Wave X1 (1646.24) is penetrated. Thus, Higher Degree of Correction is still being prolong by these Multiple Complex Waves WXYXZ.
All waves' count and projected target are generated based on past/current price level and it may be subjected to vary if degree of momentum movement change.
Prevailing trend could be emerged if Daily levels listed below was broken:
Resistance - 1615, 1620, 1625-1628, 1639, 1645, 1650, 1662, 1679, 1685, 1700, 1720
Immediate resistance - 1590-1593, 1600, 1608-1610
Immediate Support - 1583, 1574, 1570, 1562-63, 1556-1560
Support - 1544-1548, 1540, 1535, 1530, 1528, 1525, 1512, 1505, 1500, 1495, 1490, 1484-1488, 1475 , 1461-1466, 1452, 1435
==================================================================================
Patient is required for the SUPER CYCLE Bull Run.
=================================================================================
Let's Mr Market pave the waves.
Trade safely
Wave Believer


.png)