Weekly Time Frame
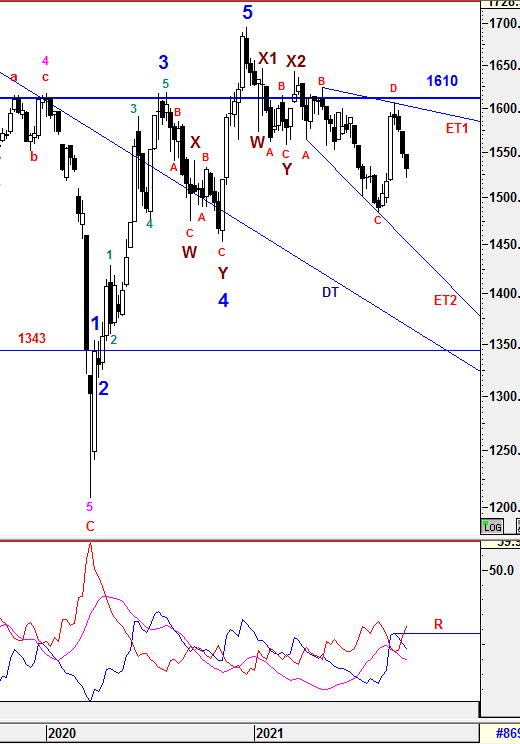
To recap from prior session 76, downward pressure continued and sent KLCI to lower level but supported at DT2 line. An short term consolidation above DT2 line was expected before clear signal signal emerged.
{{{{{{{{{{{{{{{{{{{{{{{{{{{{{{{{{{{{{{{{{{{{{{{{{{{
For the past one week, sentiment continued to be weak and selling pressure emerged to initiate another selling momentum to form Three Black Crows Candlestick formation. It indicated that Bearish momentum could continue which would lead KLCI to succumb for more downside at least a week and estimating downward movement along the Expanding Triangle Formation (ET1 - ET2). Let's check the temperature of the trend.
TREND indicators
1) -DMI (red line) is still heading up with consistent margin indicates bear strength is increasing with consistent pace. It penetrated resistance R indicates Bearish momentum may continue.
2) +DMI (blue line) is still heading down with consistent margin indicates bull strength is decreasing with consistent pace.
3) ADX (pink line) is still decreasing with decreasing margin implying that the volatility of the current trend is still in slow pace.
Therefore, the summations of the 3 signals above is still implying Bear strength is in favor. +DMI has crossed below -DMI for the second week indicating the Bull strength is out of favor but slower ADX has indicated the current trend is not firmed yet. Since all indications is still favor on Bearish mode together with the Bearish Candle Formation mentioned above, I am expecting KLCI will test lower level towards ET2 in medium term unless an immediate trend reversal signal emerged. Otherwise, caution is still required if ET1 could be penetrated to the upside.
}}}}}}}}}}}}}}}}}}}}}}}}}}}}}}}}}}}}}}}}}}}}}}}}}}}}
From wave count perspective, the Higher Degree of Correction wave would be prolong with Multiple WXYXZ complex waves before a new set of Higher Degree of Bull Wave take place. Besides that, wave D has been justified to end at 1604.98 and wave E might be in its way down. Therefore, Wave Z is still not been realized yet. Subsequent minor waves would be elaborated further in daily time frame.
Prevailing trend could be emerged if Weekly levels listed below was broken:
Resistance - 1610, 1615, 1619, 1627, 1633, 1642, 1650, 1700, 1720
Immediate Resistance - 1535, 1541, 1556, 1564, 1571, 1575, 1580, 1590, 1595, 1600
Immediate Support - 1530, 1520-23, 1510, 1505, 1500
Support - 1484-1488, 1474-1476, 1466, 1452, 1447, 1436, 1407
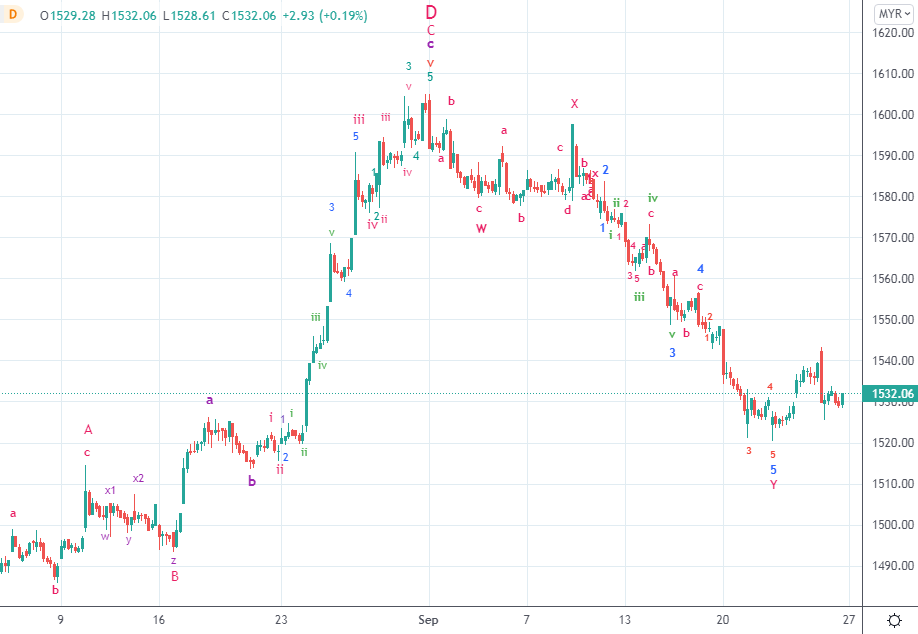
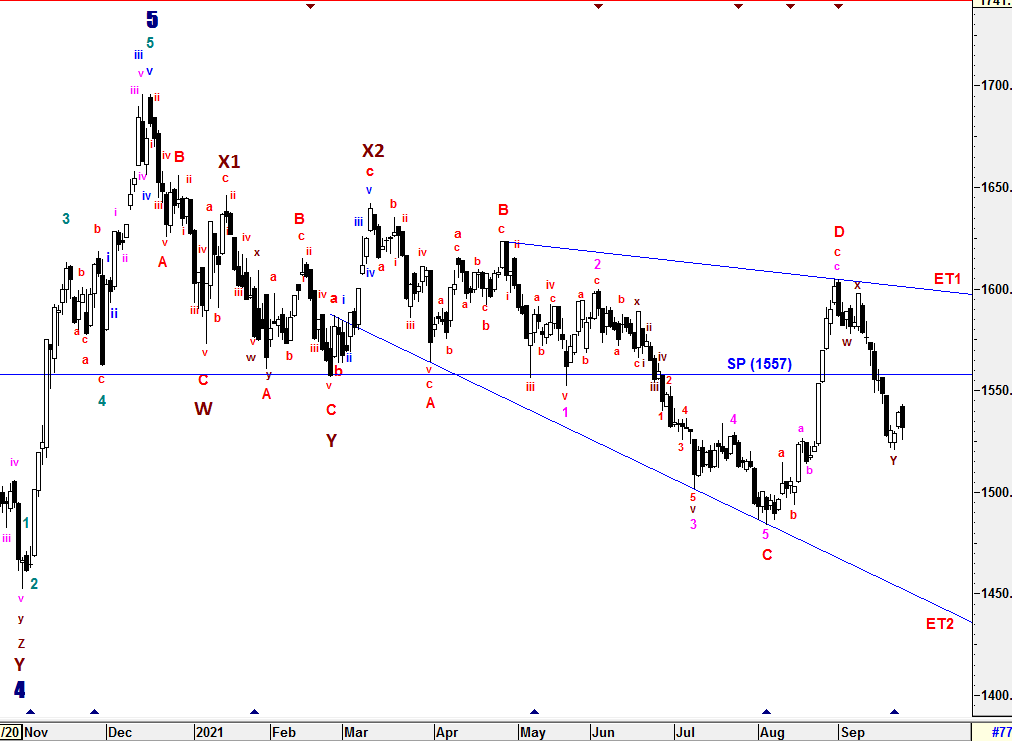
Daily Time Frame
To recap from session 76, no doubt that micro sub minuette waves Y had formed an extension waves where it sent KLCI to the low of 1543.08 which 5 points beyond 1548 (FIBO 61.8% of micro sub minuette waves 3). Although it had met the minimum criteria, i won't justified it to end here as sub minuette wave 5 of micro sub minuette waves Y was still being structured and i won't rule out it will end lower at an possible target of 1540 (FIBO 100% of sub minuette wave 1). Since KLCI had returned below SP and DT line, the wave structure of sub minuette wave 5 was monitored closely.
{{{{{{{{{{{{{{{{{{{{{{{{{{{{{{{{{{{{{{{{{{{{{{{{{{{{
Due to momentum changed, wave D has been justified earlier after 1526.34 breached where the high of micro sub minuette waves 3 (1604.98) is justified as wave D instead as labelled as corrective wave. If the current assumption is true, wave E has already been in the midst of structuring towards to the downside. Besides that, the entire wave ABCD is forming an Expanding Triangle Formation (ET1 - ET2) where we may estimate wave E would heading towards ET2 THEORETICALLY. Currently, micro sub minuette waves WXY is completed within wave E and i won't rule out that any possible rebound may drive KLCI up to 1553 (38.2%) or 1573 (61.8%) before heading downward.
As usual, i am still leaving Wave Z alone since the assumption of new corrective wave above is still yet to be justified with wave E is still in the run unless there is an new catalyst to drive KLCI to penetrate above ET1 for new wave structure.
To reiterate, Wave Z could be formed in various correctives wave structure (Zig-Zag, Flat, Diagonal and etc) with momentum changes.
}}}}}}}}}}}}}}}}}}}}}}}}}}}}}}}}}}}}}}}}}}}}}}}}}}}}
Since Multiple Complex Wave emerged, the new set of Higher Degree of 5 Waves Bull Run or Primary Wave 3 have yet to be seen until all corrective waves are served convincingly unless Wave X1 (1646.24) is penetrated. Thus, Higher Degree of Correction is still being prolong by these Multiple Complex Waves WXYXZ.
All waves' count and projected target are generated based on past/current price level and it may be subjected to vary if degree of momentum movement change.
Prevailing trend could be emerged if Daily levels listed below was broken:
Resistance - 1615, 1620, 1625-1628, 1639, 1645, 1650, 1662, 1679, 1685, 1700, 1720
Immediate resistance - 1532, 1540, 1544-1548, 1556-1557, 1562-63, 1570, 1573, 1581, 1590-1593, 1600, 1608-1610
Immediate Support - 1530, 1528, 1525, 1515, 1512
Support - 1505, 1500, 1495, 1490, 1484-1488, 1475 , 1461-1466, 1452, 1435
==================================================================================
Patient is required for the SUPER CYCLE Bull Run.
=================================================================================
Let's Mr Market pave the waves.
Trade safely
Wave Believer