Monthly Time Frame
To recap from session 74, KLCI was able to rebound strongly and returned above 1566 due to momentum driven by an political catalyst. I was expecting it would consolidating above 1566 before clearer signal emerged.
{{{{{{{{{{{{{{{{{{{{{{{{{{{{{{{{{{{{{{{{{{{{{{{{{{{{
For the past one month, weak momentum drove KLCI returned below 1566 and next support is 1494. A breached below 1494 would ignite a stronger momentum for more downside in longer run.
}}}}}}}}}}}}}}}}}}}}}}}}}}}}}}}}}}}}}}}}}}}}}}}}}}}}
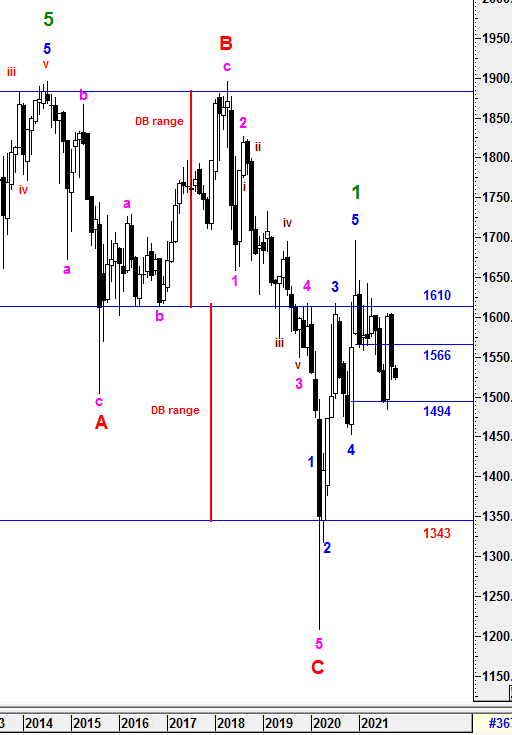
On wave counts perspective, Primary Wave 1 could be formed after 5 Higher Degree of Impulsive Bull Waves had been structured from March to Dec 2020. No doubt that Primary Wave 2 correction is underway which expected to be a prolong waves unless a unknown catalyst emerged to re-write the extension waves within. Therefore, smaller time frame would be monitor closely for any unexpected waves incurred. Subsequent minor waves would be elaborated further in daily time frame.
To reiterate, the Double Top Formation (DB range) structure formed in between July 2014 and April 2018 could be overwritten by Primary Wave 3 Bull Run when Primary Wave 2 Correction end.
The new Super Cycle Bull Wave is still valid and expecting some knee jerk reactions along the prolong cycle.
Prevailing trend could be emerged if Monthly levels listed below was broken:
Resistance : 1533, 1538, 1566, 1601.65, 1610, 1627, 1643
Support : 1524, 1504-1500, 1494, 1465
Weekly Time Frame
To recap from prior session 77, sentiment continued to be weak and selling pressure emerged to initiate another selling momentum to form Three Black Crows Candlestick formation. It indicated that Bearish momentum could continue which would lead KLCI to succumb for more downside at least a week and estimating downward movement along the Expanding Triangle Formation (ET1 - ET2).
{{{{{{{{{{{{{{{{{{{{{{{{{{{{{{{{{{{{{{{{{{{{{{{{{{{{
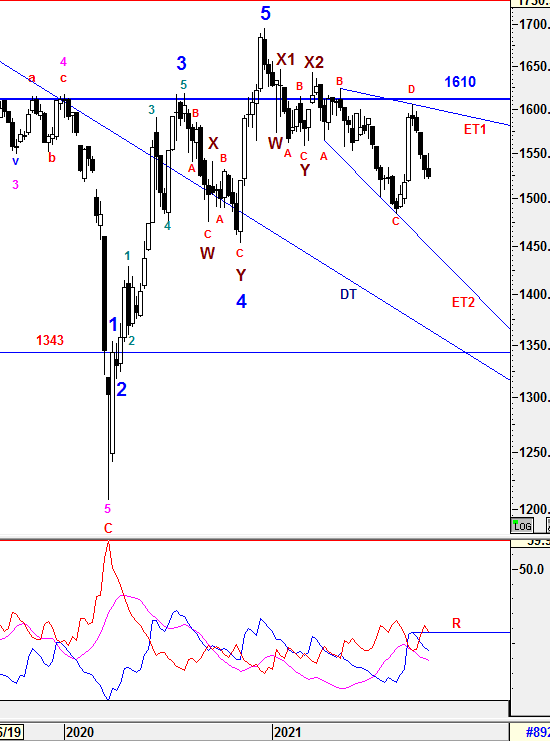
For the past one week, weaker momentum continued and closed below 1532 to realize Three Black Crows Candlestick which indicates downward pressure still remain. Therefore, i am still holding the view that the downward momentum emerged within the Expanding Triangle Formation (ET1 - ET2). Let's check the temperature of the trend.
TREND indicators
1) -DMI (red line) curved down with lower margin indicates bear strength is decreasing with slower pace. Bearish momentum may continue even It supported at resistance R.
2) +DMI (blue line) is still heading down with lower margin indicates bull strength is decreasing with lower pace.
3) ADX (pink line) is still decreasing with decreasing margin implying that the volatility of the current trend is still in slow pace.
Therefore, the summations of the 3 signals above is still implying Bear strength is in favor. +DMI has crossed below -DMI for the third week indicating the Bull strength is still out of favor and slower ADX has indicated the current trend is not firmed yet. Since all indications is still favor on Bearish mode together with the realization of Bearish Candle Formation mentioned above, I am expecting KLCI will test lower level towards ET2 in Medium Term unless an immediate trend reversal signal emerged. Otherwise, caution is still required unless ET1 could be penetrated to the upside.
}}}}}}}}}}}}}}}}}}}}}}}}}}}}}}}}}}}}}}}}}}}}}}}}}}}}
From wave count perspective, the Higher Degree of Correction wave would be prolong with Multiple WXYXZ complex waves before a new set of Higher Degree of Bull Wave take place. Besides that, wave D has been justified to end at 1604.98 and wave E might be in its way to the downside. Therefore, Wave Z is still not been realized yet. Subsequent minor waves would be elaborated further in daily time frame.
Prevailing trend could be emerged if Weekly levels listed below was broken:
Resistance - 1610, 1615, 1619, 1627, 1633, 1642, 1650, 1700, 1720
Immediate Resistance - 1530, 1535, 1541, 1556, 1564, 1571, 1575, 1580, 1590, 1595, 1600
Immediate Support - 1520-23, 1510, 1505, 1500
Support - 1484-1488, 1474-1476, 1466, 1452, 1447, 1436, 1407
Daily Time Frame
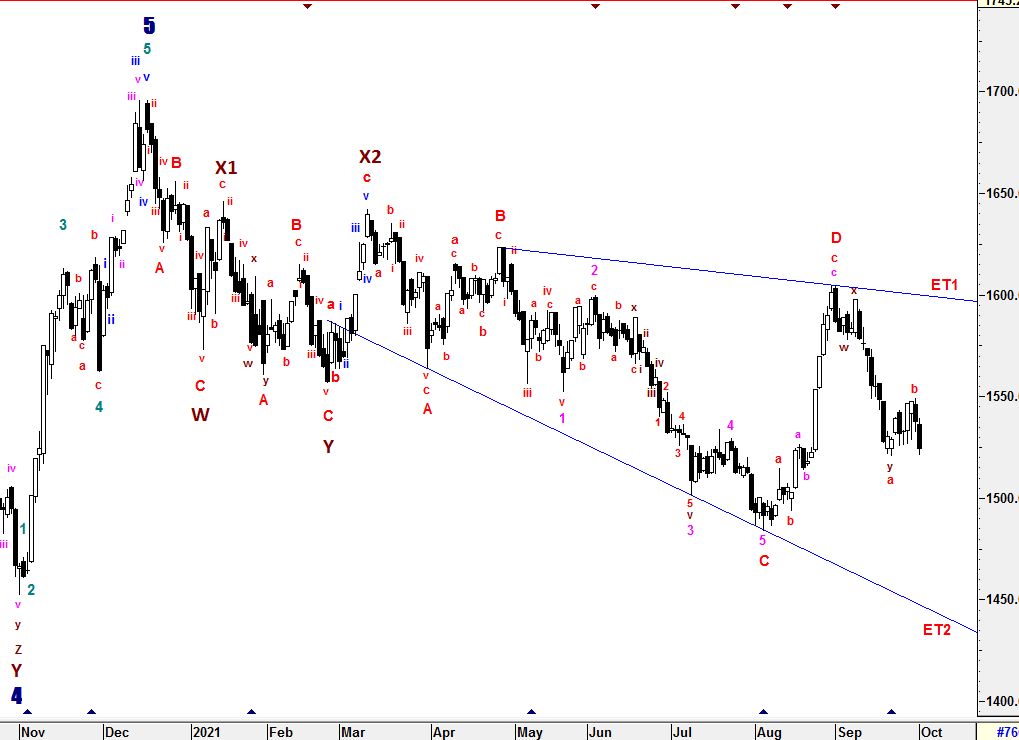
To recap from session 77, wave D had been justified earlier after 1526.34 breached where the high of micro sub minuette waves 3 (1604.98) was justified as wave D instead as labelled as corrective wave. If the current assumption was true, wave E had already been in the midst of structuring towards to the downside. Besides that, the entire wave ABCD was forming an Expanding Triangle Formation (ET1 - ET2) where we might estimate wave E would heading towards ET2 THEORETICALLY. Currently, micro sub minuette waves WXY was completed within wave E and i won't rule out that any possible rebound might drive KLCI up to 1553 (38.2%) or 1573 (61.8%) before heading downward.
{{{{{{{{{{{{{{{{{{{{{{{{{{{{{{{{{{{{{{{{{{{{{{{{{{{{
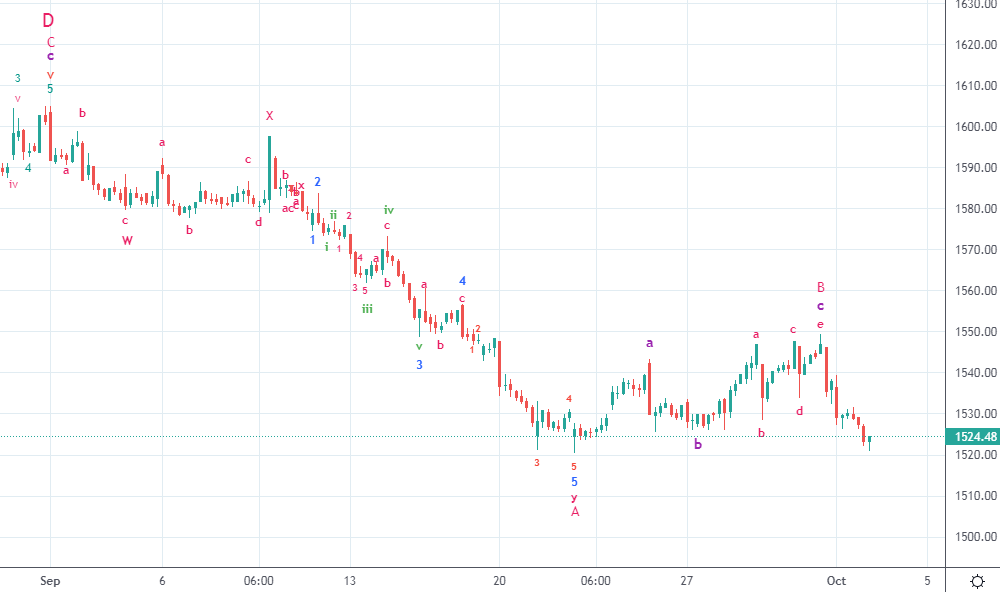
For the past one week, there was an rebound but weaker than expected due to uncertainty emerged. As the prior assumption is still hold, wave E is still underway and believe moving towards ET2 as mentioned. As in wave counts perspective, micro sub minuette waves WXY as justified as sub minuette waves a and sub minuette waves b is completed with almost met the minimum criteria FIBO 38.2% at 1553 as labelled. However, i won't rule out that there could still some rebound reaction towards FIBO 38.2% to end sub minuette waves b with new wave structure.
As usual, i am still leaving Wave Z alone since the assumption of new corrective wave above is still yet to be justified with wave E is still in the run unless there is an new catalyst to drive KLCI to penetrate above ET1 for new wave structure.
To reiterate, Wave Z could be formed in various correctives wave structure (Zig-Zag, Flat, Diagonal and etc) with momentum changes.
}}}}}}}}}}}}}}}}}}}}}}}}}}}}}}}}}}}}}}}}}}}}}}}}}}}}
Since Multiple Complex Wave emerged, the new set of Higher Degree of 5 Waves Bull Run or Primary Wave 3 have yet to be seen until all corrective waves are served convincingly unless Wave X1 (1646.24) is penetrated. Thus, Higher Degree of Correction is still being prolong by these Multiple Complex Waves WXYXZ.
All waves' count and projected target are generated based on past/current price level and it may be subjected to vary if degree of momentum movement change.
Prevailing trend could be emerged if Daily levels listed below was broken:
Resistance - 1615, 1620, 1625-1628, 1639, 1645, 1650, 1662, 1679, 1685, 1700, 1720
Immediate resistance - 1525, 1528, 1530, 1532, 1540, 1544-1548, 1556-1557, 1562-63, 1570, 1573, 1581, 1590-1593, 1600, 1608-1610
Immediate Support - 1515, 1512, 1505, 1500
Support - 1495, 1490, 1484-1488, 1475 , 1461-1466, 1452, 1435
==================================================================================
Patient is required for the SUPER CYCLE Bull Run.
=================================================================================
Let's Mr Market pave the waves.
Trade safely
Wave Believer


hotstock1975
sub minuette waves c is in the making towards ET2. Downward momentum will be strong once 1514 breached. Finger Cross and Take Care!
2021-10-04 16:10