Weekly Time Frame
To recap from prior session 82, bearish divergence had driven KLCI to end lower for the second session which was further down away from ET1 line. Besides that, one of the critical support 1564 had breached which indicated weakness might still emerging next week.
{{{{{{{{{{{{{{{{{{{{{{{{{{{{{{{{{{{{{{{{{{{{{{{{{{{{
For the past one week, no doubt that weakening momentum initiated another selling pressure and created an gap down effect which indicated weaknesses would still emerging for coming weeks. Let's check the temperature of the trend.
TREND indicators
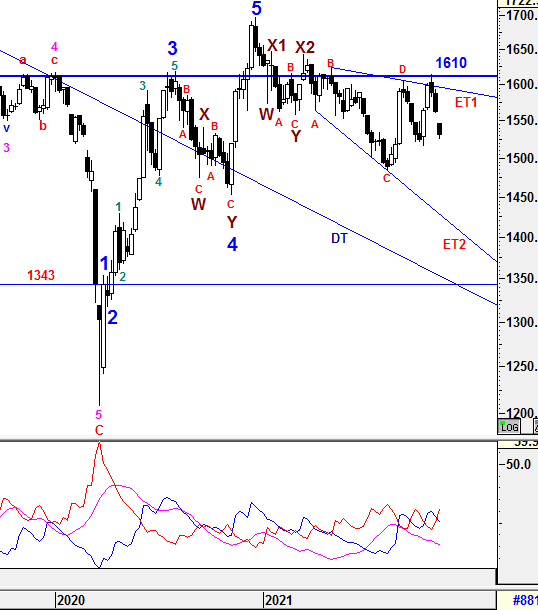
1) -DMI (red line) continued heading up with greater margin indicates bear strength is increasing with greater pace.
2) +DMI (blue line) continued heading down with greater margin indicates bull strength is decreasing with greater pace.
3) ADX (pink line) is decreasing with consistent margin implying that the volatility of the current trend is still low and weak.
Therefore, the summations of the 3 signals above is still implying Bear strength is in favor. -DMI has crossed above +DMI for the first week indicating the Bear strength is in favor but slower ADX has indicated the current trend is still weak and not firmed yet. Since KLCI has gap down, I am still expecting KLCI will be consolidating in between ET1 and ET2 in Medium Term which bias to the downside as any rebound would not be as solid trend reversal. Therefore, caution is still required unless ET1 or 1610 could be penetrated to the upside CONVINCINGLY.
}}}}}}}}}}}}}}}}}}}}}}}}}}}}}}}}}}}}}}}}}}}}}}}}}}}}
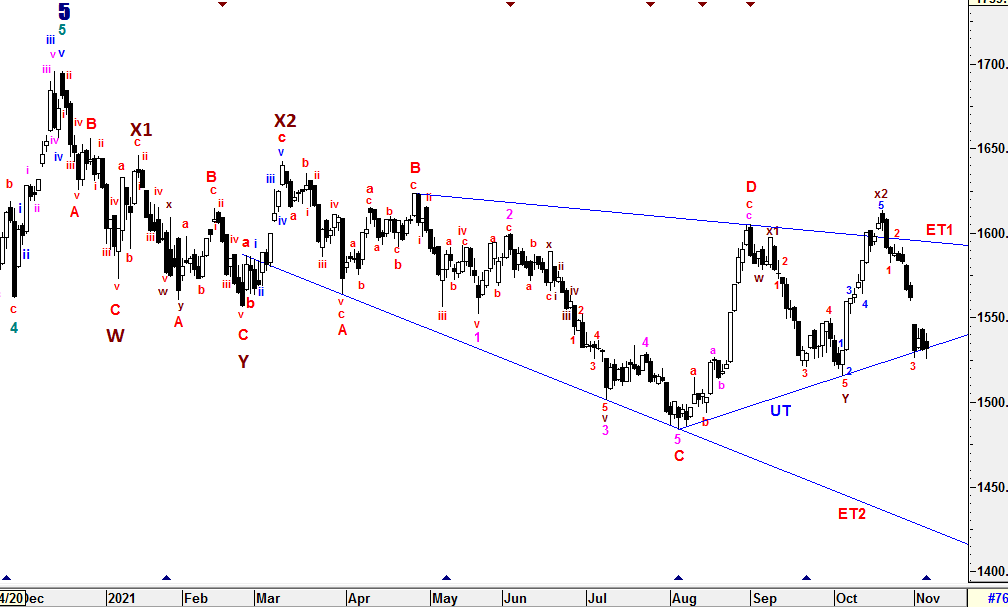
From wave count perspective, the Higher Degree of Correction wave would be prolong with Multiple WXYXZ complex waves before a new set of Higher Degree of Bull Wave take place. Besides that, wave D has been justified to end at 1604.98 and wave E might be in its way to the downside. Therefore, Wave Z is still not been realized yet. Subsequent minor waves would be elaborated further in daily time frame.
Prevailing trend could be emerged if Weekly levels listed below was broken:
Resistance - 1633, 1642, 1650, 1700, 1720
Immediate Resistance - 1533, 1546-1560 (Gap), 1564, 1571, 1575, 1580, 1590, 1595, 1600, 1610, 1615, 1619, 1627
Immediate Support - 1530, 1520-23, 1510, 1505, 1500
Support - 1484-1488, 1474-1476, 1466, 1452, 1447, 1436, 1407
Daily Time Frame
To recap from session 82, KLCI continued to move downward and created a gap down on Thursday. These might fuel another possible selling in next few days before it consolidated. As mentioned, sub minuette z could have started with sub minuette 3rd wave was still being constructed to the downside as labelled. if this was true, UT line was the level to watch for any short term rebound.
{{{{{{{{{{{{{{{{{{{{{{{{{{{{{{{{{{{{{{{{{{{{{{{{{{{{
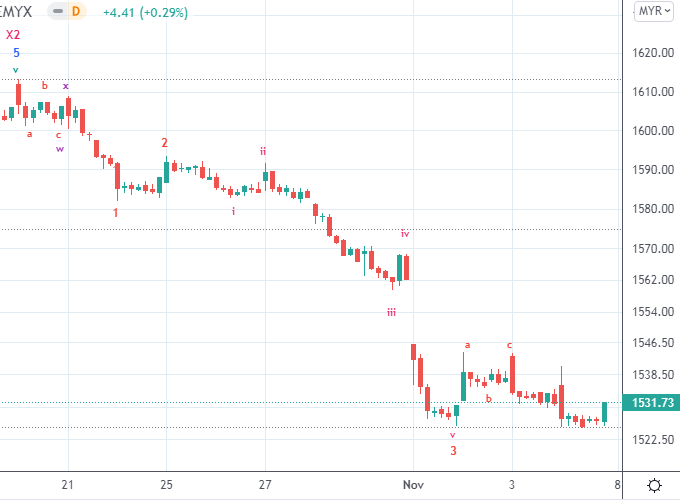
For the past one week, selling pressure continued for initiating another gap down effect with greater margin. Although KLCI has been supported well above UT line as mentioned, the gap effect is still indicates there is still underlying weaknesses emerged. On wave counts perspective, sub minuette 3rd wave has been completed and ended at 1526.04. Currently, i am seeing sub minuette 4th wave is still being constructed with an possible minuette complex waves before sub minuette 5th wave emerged to the downside in conjunction with UT line breaching and possible extension waves incurred. I am watching closely whether KLCI is able to rebound and close up the gap created 1545.99 - 1559.66 where new wave structure could emerged.
As usual, i am still leaving Wave Z alone since the assumption of new corrective wave above is still yet to be justified with wave E is still in the run unless there is an new catalyst to drive KLCI to penetrate above ET1 or 1610 Convincingly for new wave structure.
}}}}}}}}}}}}}}}}}}}}}}}}}}}}}}}}}}}}}}}}}}}}}}}}}}}}
To reiterate, Wave Z could be formed in various correctives wave structure (Zig-Zag, Flat, Diagonal and etc) with momentum changes.
Since Multiple Complex Wave emerged, the new set of Higher Degree of 5 Waves Bull Run or Primary Wave 3 have yet to be seen until all corrective waves are served convincingly unless Wave X1 (1646.24) is penetrated. Thus, Higher Degree of Correction is still being prolong by these Multiple Complex Waves WXYXZ.
All waves' count and projected target are generated based on past/current price level and it may be subjected to vary if degree of momentum movement change.
Prevailing trend could be emerged if Daily levels listed below was broken:
Resistance - 1639, 1645, 1650, 1662, 1679, 1685, 1700, 1720
Immediate resistance - 1537, 1545.99 (Lower Gap), 1556-1557, 1559.66 (Upper Gap) ,1566, 1570, 1573, 1581, 1590-1593, 1599-1602, 1608-1610, 1615, 1620, 1625-1628
Immediate Support - 1530, 1522, 1515, 1512, 1505, 1500
Support - 1495, 1490, 1484-1488, 1475 , 1461-1466, 1452, 1435
==================================================================================
Patient is required for the SUPER CYCLE Bull Run.
=================================================================================
Let's Mr Market pave the waves.
Trade safely
Wave Believer