


WahLau Stock
Computer Gaming Points/ Stats System In Stock Selection

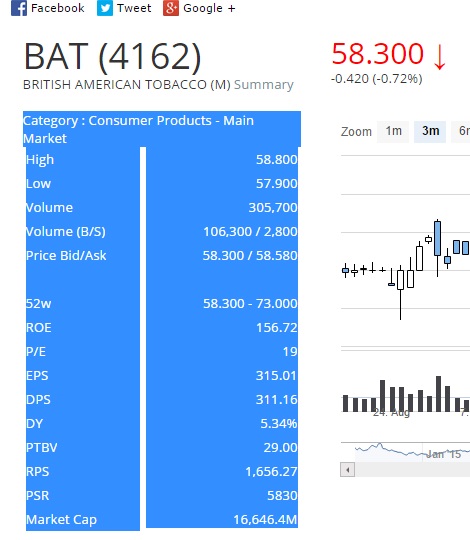
Now a day, we got a lot of free stock screener software (For example KLSE screener http://www.klsescreener.com/v2/).
Computer game like EA FIFA, each football players have own stats. Base on those stats, we can estimate they performance.
I combine both systems to help us to find stock in faster time.

Combine both KLSE screener and FIFA stats system
1.) Copy data from KLSE screener and paste in Microsoft Excel.
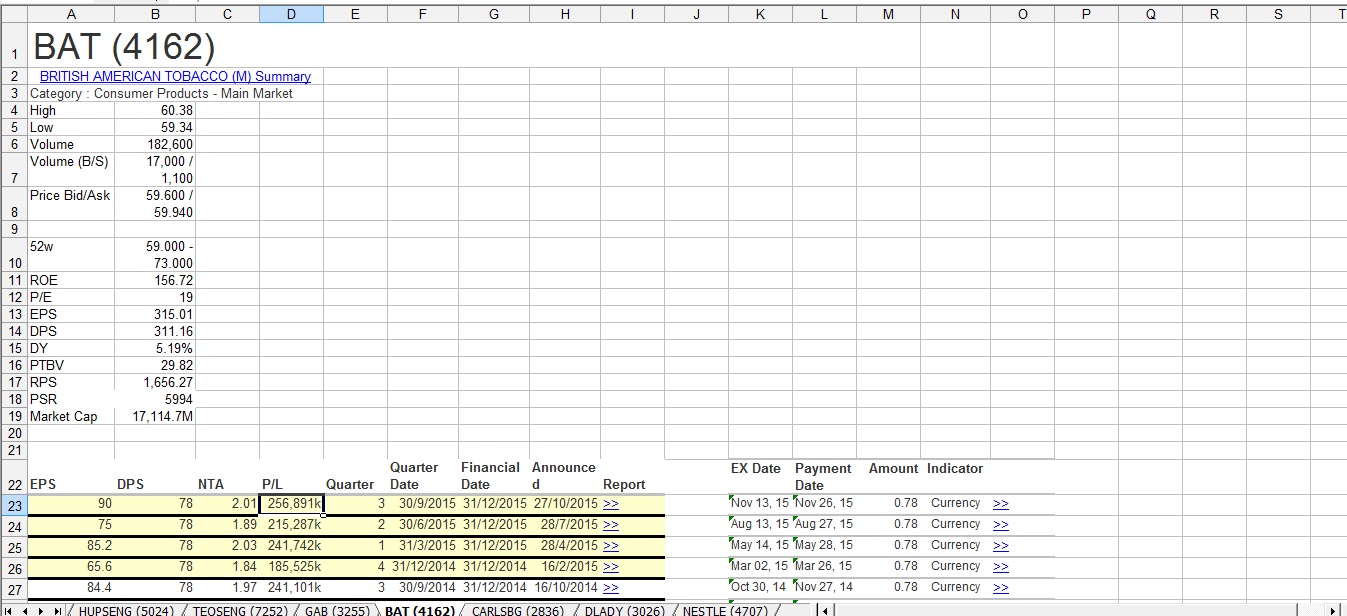
2.) Using excel logic to get the point.
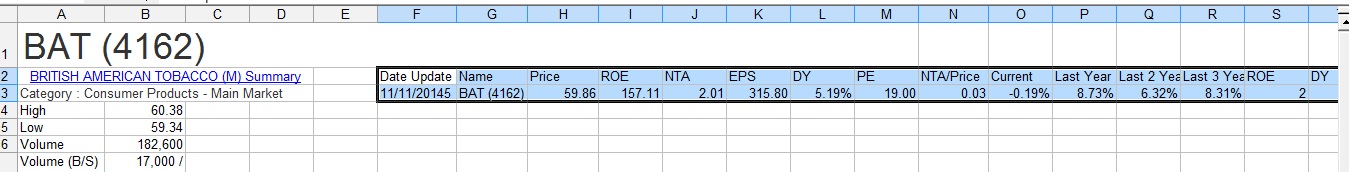
3.) Copy and paste special (value only)
4.) Sort Descending
5.) Select and check the top results NTA, if found abnormal remark NG.
6.) Backtesting it (Base on Last day give Div or Quarter report)
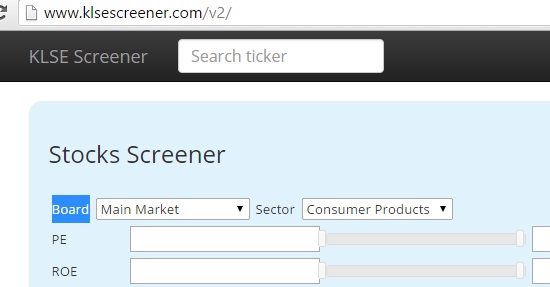
Below I using Board Main Market and sector: Consumer Products to get the data.
I get the points>8.5 result as below:
| Date Update | Name | ROE | DY | PE | NTA/Price | Current | Last Year | Last 2 Year | Last 3 Year | Totals | Remark |
Last Quarter / DY Payment data |
KLSE Next Open |
KLSE 12/11/2015 | KLSE Change % | Price Next Day | 12/11/2015 Price | Stock Change % |
| 11/11/2015 | POHUAT (7088) [s] | 1.5 | 0.5 | 0 | 0.5 | 4 | 2 | 2 | 2 | 12.5 | OK | 16/10/2015 | 1712.08 | 1663.2 | -2.86% | 1.52 | 1.58 | 3.95% |
| 11/11/2015 | MAGNI (7087) [s] | 1.5 | 1 | 0 | -0.5 | 4 | 2 | 2 | 2 | 12 | OK | 9/9/2015 | 1592.16 | 1663.2 | 4.46% | 4.64 | 5.79 | 24.78% |
| 11/11/2015 | LIIHEN (7089) [s] | 1.5 | 1 | 0 | 0.5 | 4 | 2 | 0.5 | 2 | 11.5 | OK | 23/9/2015 | 1604.15 | 1663.2 | 3.68% | 6.93 | 8.1 | 16.88% |
| 11/11/2015 | LTKM (7085) [s] | 2 | 1 | 1.5 | 0 | 4 | 2 | 2 | -1.5 | 11 | NG | |||||||
| 11/11/2015 | PWROOT (7237) [s] | 2 | 1.5 | -1 | -1 | 4 | 0.5 | 2 | 2 | 10.5 | OK | 25/8/2015 | 1559.75 | 1663.2 | 6.63% | 2.1 | 2.75 | 30.95% |
| 11/11/2015 | OFI (7107) [s] | 1.5 | 0.5 | -1 | 0.5 | 4 | -0.5 | 2 | 2 | 9.5 | OK | 21/9/2015 | 1640.58 | 1663.2 | 1.38% | 5.79 | 8.76 | 51.30% |
| 11/11/2015 | JERASIA (8931) [s] | 0.5 | 0.5 | 1.5 | 1.5 | 4 | 0.5 | -1.5 | 2 | 9 | OK | 19/9/2015 | 1661.54 | 1663.2 | 0.10% | 0.69 | 0.88 | 27.54% |
| 11/11/2015 | LATITUD (7006) [s] | 1.5 | 0.5 | 1 | -0.5 | 4 | 2 | 2 | -1.5 | 9 | OK | 27/8/2015 | 1609.04 | 1663.2 | 3.37% | 7.31 | 6.58 | -9.99% |
| 11/11/2015 | TEOSENG (7252) [s] | 2 | 1.5 | 0 | -1 | 4 | 2 | 2 | -1.5 | 9 | OK | 29/9/2015 | 1602.52 | 1663.2 | 3.79% | 1.49 | 1.72 | 15.44% |
| 11/11/2015 | UPA (7757) [s] | 0.5 | 1.5 | 1 | 1 | 4 | -1.5 | 2 | 0.5 | 9 | OK | 24/8/2015 | 1515.73 | 1663.2 | 9.73% | 1.56 | 1.7 | 8.97% |
| 11/11/2015 | FCW (2755) [s] | 2 | 1.5 | 2 | -0.5 | 4 | -1.5 | 2 | -1.5 | 8 | OK | Average | 3.36% | 18.87% |
Average KLSE increase is 3.36% but by using this point system with setting as below average increase to 18.87%.
We can set our point system aggressive or defensive. For defensive setting, dividend in high point. But for aggressive setting, ROE and EPS increasing year by year high point.
Below is how I set my point, If your have any suggestion please advice and thanks.
| ROE | DY | PE | NTA/Price | Current | Last Year | Last 2 Year | Last 3 Year |
|
-10 - -5 -1 point -5 - 0 -0.5 point 0-5 0 point 5-10 0.5 point 10-15 1.0 point 15-20 1.5 point >20 2.0 point |
0 0 point 0.0-2.0 0.5 point 2.0-4.0 1.0 point 4.0-6.0 1.5 point >6.0 2.0 point |
<0 -2 point >30 -1.5 point 23.0-30.0 -1.0 point 17.0-23.0 -0.5 point 12.0-17.0 0 point 10.0-12.0 0.5 point 8.0-10.0 1.0 point 6.0-8.0 1.5 point <6.0 2.0 point |
<0.5 -1.0 point 0.5-0.9 -0.5 point 0.9-1.1 0 point 1.1-1.3 0.5 point 1.3-1.6 1.0 point 1.6-1.9 1.5 point >1.9 2.0 point |
<-8% -4 point -8% to -5% -3 point -5% to -2% -2 point -2% to 0% -1 point N/A 0 point 0% to 3% 1 point 3% to 6% 2 point 6% to 9% 3 point 9% to 12% 4 point |
<-8% -2 point -8% to -5% -1.5 point -5% to -2% -1.0 point -2% to 0% -0.5 point N/A 0 point 0% to 3% 0.5 point 3% to 6% 1.0 point 6% to 9% 1.5 point 9% to 12% 2.0 point |
<-8% -2 point -8% to -5% -1.5 point -5% to -2% -1.0 point -2% to 0% -0.5 point N/A 0 point 0% to 3% 0.5 point 3% to 6% 1.0 point 6% to 9% 1.5 point 9% to 12% 2.0 point |
<-8% -2 point -8% to -5% -1.5 point -5% to -2% -1.0 point -2% to 0% -0.5 point N/A 0 point 0% to 3% 0.5 point 3% to 6% 1.0 point 6% to 9% 1.5 point 9% to 12% 2.0 point |
*For your information, I don't yet open my stock account and for my study propose only.
Discussions
1 person likes this. Showing 2 of 2 comments
On another note, stock screeners usually have limited data that you can extract. But it also depends on what criteria you look for.
Some noteable criteria that most stock screener are lacking:
1. Return on Invested Capital (ROIC)
2. Free Cash Flow (FCF)
3. Return on Asset (ROA)
4. Cash Return on Invested Capital (CROIC)
5. Earnings Before Interest & Taxes over Enterprise Value (EBIT/EV)
6. Profit Margins (Gross profit, net profit etc)
7. Other financial ratios such as debt ratio, current ratio, dividend payout ratio etc
You may or may not use these for selection criteria but ultimately it depends on what you are really looking for. I think you have a good start.
2015-11-29 01:51
Post a Comment
Featured Posts
Introducing MY's First IPO Fund for Sophisticated Investors!
New Update. Discover investment communities that resonate with your ideas
M & A Value Partners IPO Equity Fund has been launched - Targeted 13% Return p.a
Latest Videos


Apps


Top Articles
1
3
4
save malaysia!
Visa-free travel to China extended for Malaysians to 30 days
5
6
7
Good Articles to Share
8
Good Articles to Share
Four convicted in Spain over homophobic murder that sparked nationwode protests
#
Stock
Score
Daily Stocks
Stock Name
Last
Change
Volume
Stock Name
Last
Change
Volume
Stock Name
Last
Change
Volume
MQ Trading Signals
Stock
Time
Signal
Duration
Stock
Time
Signal
Duration
Featured Advertisers / Partners


Ride The Bull Short The Bear
CS Tan
4.9 / 5.0
This book is the result of the author's many years of experience and observation throughout his 26 years in the stockbroking industry. It was written for general public to learn to invest based on facts and not on fantasies or hearsay....
shinado
I like how you try to develop a point system for your stock selection. It's interesting. But I must say, sometimes for NTA/price it makes no sense.
For example, take Nestle.
Last Q report shows that NTA is at RM3.45. Trading price is RM73.60. But does it make it a bad stock? Not really. And it can be the other way round too. Some companies have high NTA/price, but fundamentally it's a bad stock.
I don't know how you intend to make changes for it. But from my point of view, the stocks you have selected based on this system are mostly good stocks. Congrats!
2015-11-29 01:26