


iVSA Stock Review
IFCA MSC Berhad

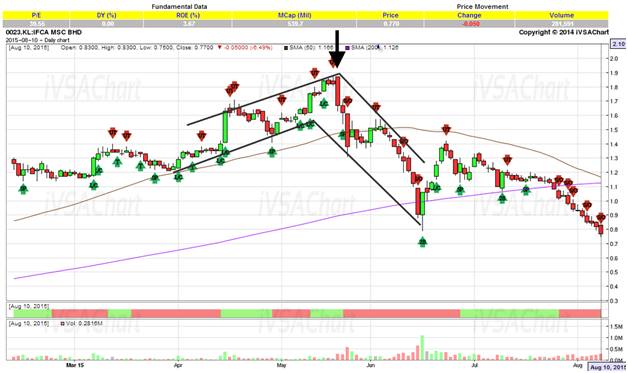
IFCA has been a very active share recently. With high volume (top 10 highest volume from time to time), it attracted many investors and traders. Based on the chart above, we are able to see that the first arrow indicates the first SOW (sign of weakness). As we can see the Upthrust happened on the day before the huge sell down happens (with higher volume relatively). It confirmed the Upthrust and sell down happens. After what seemed like a 2 bar reversal at the bottom, the price recovered slightly but if we are able to look at it more carefully, we will spot that the spring that happens 26 June and 2 bar reversal on 9 July are not confirmed. No sign of strength appear and it was probably a mere trap for the greed. After the sell down, we are only able to see that the stock price is going on a down trend.
Many people like active stocks especially those that are on the top 10 most active board. These are mainly due to news, spread of words, advice and many people thinks that they could make money from the fast moving stock, in other words, being impatient. Many people follow the crowd blindly and there’s where many people were trapped.
More articles on iVSA Stock Review
Holistic View of Leon Huat with Fundamental Analysis & iVolume Spread Analysis (iVSAChart)
Created by Joe Cool | Dec 15, 2016
Holistic View of Tomypak with Fundamental Analysis & iVolume Spread Analysis (iVSAChart)
Created by Joe Cool | Dec 15, 2016
Holistic View of ECS IT with Fundamental Analysis & iVolume Spread Analysis (iVSAChart)
Created by Joe Cool | Dec 01, 2016
Holistic View of Magni-Tech with Fundamental Analysis & iVolume Spread Analysis (iVSAChart)
Created by Joe Cool | Dec 01, 2016
Holistic View of Teo Seng with Fundamental Analysis & iVolume Spread Analysis (iVSAChart)
Created by Joe Cool | Nov 14, 2016
Holistic View of QL Resources with Fundamental Analysis & iVolume Spread Analysis (iVSAChart)
Created by Joe Cool | Nov 03, 2016
Holistic View of Top Glove with Fundamental Analysis & iVolume Spread Analysis (iVSAChart)
Created by Joe Cool | Oct 24, 2016
Holistic View of Scientex with Fundamental Analysis & iVolume Spread Analysis (iVSAChart)
Created by Joe Cool | Oct 24, 2016
Holistic View of KESM with Fundamental Analysis & iVolume Spread Analysis (iVSAChart)
Created by Joe Cool | Oct 17, 2016
Featured Posts
Introducing MY's First IPO Fund for Sophisticated Investors!
New Update. Discover investment communities that resonate with your ideas
M & A Value Partners IPO Equity Fund has been launched - Targeted 13% Return p.a
Latest Videos


Apps


Top Articles
1
TA Sector Research
2
RHB Investment Research Reports
Construction - AI’s Turning Point Likely Positive For DC Builders
3
THE INVESTMENT APPROACH OF CALVIN TAN
REPOSTING: BUSINESSES THAT LAST TILL THE END OF TIME IN BIBLE PROPHECY, Calvin Tan Blog
4
TA Sector Research
5
THE INVESTMENT APPROACH OF CALVIN TAN
6
Phillip Capital Research Reports
7
Mercury Securities Research
8
Kenanga Research & Investment
Banking - Dec 2024 Statistics: Anchored Fundamentals (OVERWEIGHT)
#
Stock
Score
Daily Stocks
Stock Name
Last
Change
Volume
Stock Name
Last
Change
Volume
Stock Name
Last
Change
Volume
MQ Trading Signals
Stock
Time
Signal
Duration
Stock
Time
Signal
Duration
Featured Advertisers / Partners


Ride The Bull Short The Bear
CS Tan
4.9 / 5.0
This book is the result of the author's many years of experience and observation throughout his 26 years in the stockbroking industry. It was written for general public to learn to invest based on facts and not on fantasies or hearsay....
johnny cash
it is going to settle at 1.00,, won t go high cause cimb target price is 1.32 at the moment,,, last time was 2.0,,being downgraded very fast ripples effects from china ha
2015-09-08 08:30