


iVSA Stock Review
Holistic View of ECS IT with Fundamental Analysis & iVolume Spread Analysis (iVSAChart)

Can ECS Reverse from its Current Downward Movement?
Background and Core Business
ECS ICT Berhad (“ECSB”), an MSC-Status company, and its subsidiaries (“the Group”) started in 1985 with the establishment of ECS KU Sdn. Bhd.. Today, the Group is a leading distribution hub for Information & Communications Technology (“ICT”) products in Malaysia via ECS ASTAR Sdn. Bhd. and ECS PERICOMP Sdn. Bhd.
Listed on the Main Market of Bursa Malaysia Securities Berhad on 15 April 2010, ECSB is an associate company of ECS Holdings Limited, which is one of the leading ICT distributors in Asia Pacific, accessing to a network of more than 25,000 channel partners across China, Thailand, Malaysia, Singapore, Indonesia, the Philippines, Cambodia and Myanmar.
ECSB distributes a comprehensive range of ICT products comprising notebooks, personal computers, smartphones, tablets, printers, software, network and communication infrastructure, servers, and enterprise software from more than 30 leading principals like Hewlett Packard, Asus, Lenovo, Apple, Dell, Microsoft, Cisco, Samsung, VMWare and IBM.
With a nationwide channel network of more than 5,500 resellers comprising of retailers, system integrators and corporate dealers, ECS also provides value-added product support and technical services.
Based on Financial Year (FY) 2015 full year results, ECS achieved RM 1.9 billion turnover, which is considered to be a large size enterprise based on turnover value. Other aspects of the company’s latest financial results are illustrated in the table below.
|
ECS IT (5162.KL) |
FY 2015 |
TTM (Sep 2016) |
|
Revenue (RM’000) |
1,903,299 |
1,768,353 |
|
Net Earnings (RM’000) |
32,488 |
27,908 |
|
Net Profit Margin (%) |
1.71 |
1.58 |
|
Return of Equity (%) |
13.72 |
11.23 |
|
Total Debt to Equity Ratio |
0.00 |
0.00 |
|
Current Ratio |
2.20 |
2.34 |
|
Cash Ratio |
0.60 |
0.50 |
|
Dividend Yield (%) |
8.03 |
- |
|
Earnings Per Share (Cent) |
18.0 |
15.5 |
|
PE Ratio |
8.36 |
8.84 |
Over the latest past five Financial Year (FY), ECS’s revenue has been on an uptrend from RM 1.25 billion in FY2011 to 1.90 billion in FY2015 which translates to a 52% increase or an average year to year increase of 11%.
In terms of net earnings, ECS has been quite stagnant from RM 30 million in FY2011 to RM 32.5 million in FY 2015, with a decreasing net profit in between with the lowest net profit at RM 26.8 million in FY2013. Relatively stagnant net profit with an increasing revenue shows the company faces thinning of profit margins over the years due to increasing overheads and cost of revenue.
Net profit margin wise, ECS scores a 1.71%, which is a consider very low for a non-retail based distributor. Return of equity (ROE) wise ECS performs reasonably at 13.72%.
On company’s debt, ECS has an amazing zero total debt to equity ratio, meaning the company has no long term or short term debt. The company’s current ratio is excellent at 2.20 and cash ratio is acceptable at 0.60.
ECS pays a very high 8.03% dividend yield but a higher than average payout ratio of 0.61, which increased two-fold from previous year’s payout ratio of 0.36. This may mean that the company plans to have less capital expenditure and decided to pay most of the earnings to shareholders.
In conclusion, ECS is a large enterprise with good financial fundamental, especially achieving a zero-debt status and consistently increasing revenue. The only downside of its financial performance is on the stagnant net profit.
Looking at the Trailing Twelve Months (TTM) financial performance, it is projected that ECS will experience a shrink in both revenue and net profit, as the company’s three quarterly reports this year have shown decreasing revenue and net profit as compared to their respective quarterly reports last year. This may be the reason for the share price downward trend since May 2016.
Outlook for the share price is still pessimistic unless the company could achieve a strong 4th quarter results, which is unlikely due the dampened economy of Malaysia since the decline of crude oil prices and GST, causing uncertainties thus reducing spending behavior among consumers in Malaysia. The reversal will happen when the company shows signs of increasing revenue as well as net profit.
Next quarterly results announcement should be on the month of Feb 2017 for Q4 results.
iVolume Spread Analysis (iVSA) & comments based on iVSAChart software – ECS IT
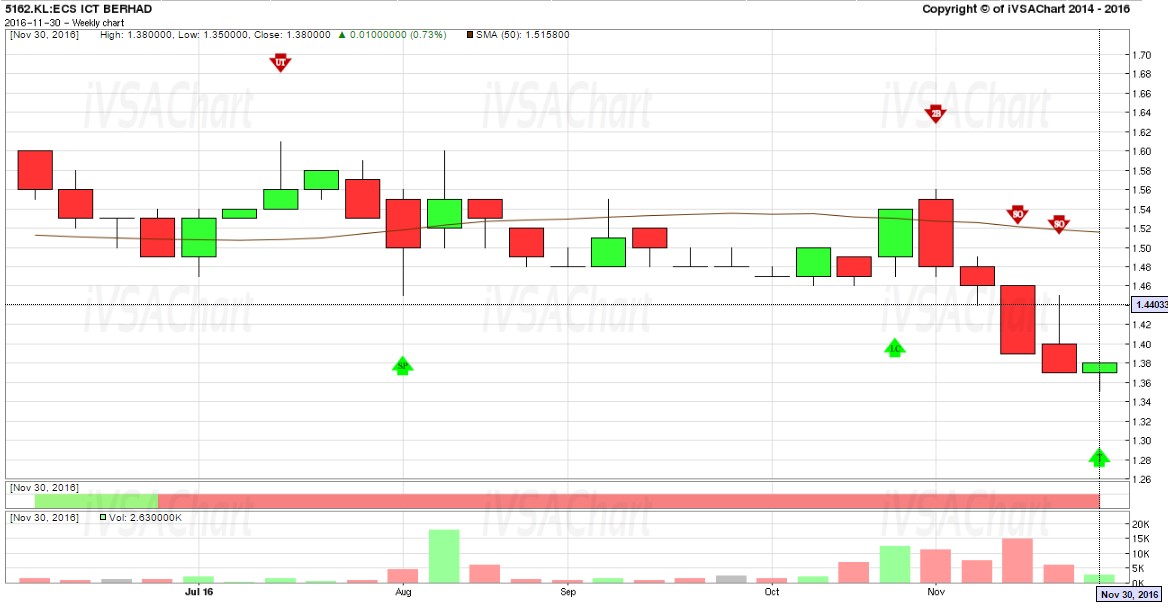
On this 6-month weekly iVSAChart of ECS IT, it had broken below its 6-month support level at around RM1.44 with heavy selling as depicted by the three Sign Of Weakness (red arrow) recently.
Although ECS IT is a consistent performer with sound fundamentals but with its breakdown of support level with accompanying volume, it is best to avoid taking position now until we see signs of smart money supporting the market. Patience is virtue here.
Interested to learn more?
- Free eBook available now! Click this URL to get your free eBook of “Get Rich with Dividends by Bill Wermine and Martin Wong”: http://ebook.ivsachart.com/
- Find out more about iVSAChart events via: https://www.ivsachart.com/events.php
- Follow & Like us on Facebook via: https://www.facebook.com/priceandvolumeinklse/
- Contact us via: email at sales@ivsachart.com or Call/WhatsApp at +6011 2125 8389/ +6018 286 9809/ +6019 645 3376
This article only serves as reference information and does not constitute a buy or sell call. Conduct your own research and assessment before deciding to buy or sell any stock. If you decide to buy or sell any stock, you are responsible for your own decision and associated risks.
Related Stocks
| Chart | Stock Name | Last | Change | Volume |
|---|
Market Buzz
More articles on iVSA Stock Review
Holistic View of Leon Huat with Fundamental Analysis & iVolume Spread Analysis (iVSAChart)
Created by Joe Cool | Dec 15, 2016
Holistic View of Tomypak with Fundamental Analysis & iVolume Spread Analysis (iVSAChart)
Created by Joe Cool | Dec 15, 2016
Holistic View of Magni-Tech with Fundamental Analysis & iVolume Spread Analysis (iVSAChart)
Created by Joe Cool | Dec 01, 2016
Holistic View of Teo Seng with Fundamental Analysis & iVolume Spread Analysis (iVSAChart)
Created by Joe Cool | Nov 14, 2016
Holistic View of QL Resources with Fundamental Analysis & iVolume Spread Analysis (iVSAChart)
Created by Joe Cool | Nov 03, 2016
Holistic View of Top Glove with Fundamental Analysis & iVolume Spread Analysis (iVSAChart)
Created by Joe Cool | Oct 24, 2016
Holistic View of Scientex with Fundamental Analysis & iVolume Spread Analysis (iVSAChart)
Created by Joe Cool | Oct 24, 2016
Holistic View of KESM with Fundamental Analysis & iVolume Spread Analysis (iVSAChart)
Created by Joe Cool | Oct 17, 2016
Featured Posts


Latest Videos


Apps


Top Articles
1
Bursa Stock Musings - Thoughts & Ideas
PGF Capital - insti shareholding up from 5% to 14%! (part 1)
2
南洋行家论股
4
The Alpha Trader
5
Koon Yew Yin's Blog
6
How to become a resilient trader
7
RHB Investment Research Reports
8
BFM Podcast
#
Stock
Score
Daily Stocks
Stock Name
Last
Change
Volume
Stock Name
Last
Change
Volume
Featured Advertisers / Partners


Ride The Bull Short The Bear
CS Tan
4.9 / 5.0
This book is the result of the author's many years of experience and observation throughout his 26 years in the stockbroking industry. It was written for general public to learn to invest based on facts and not on fantasies or hearsay....
zoizai
Q4 result is strong.
2017-02-16 12:52