


iVSA Stock Review
Holistic View of Magni-Tech with Fundamental Analysis & iVolume Spread Analysis (iVSAChart)

Background and Core Business
Magni-Tech Industries Bhd. (MAGNI) was founded in 1997 and gained listing on Bursa Malaysia’s 2nd Board in 2000. It was promoted to the Main Board in 2003. The company had its roots in the packaging business, and later diversified into the apparel manufacturing business by 2006 when it completely acquired its subsidiary South Island Garment Sdn Bhd.
Its other wholly owned subsidiaries, South Island Plastics Sdn Bhd, Inter-Pacific Packaging Sdn Bhd and South Island Packaging (Penang) Sdn Bhd are principally involved in the manufacturing of plastic packaging and carton boxes. These packaging products are used in a multitude of products, ranging from food to consumer electronics.
Based on the latest annual report, the garment business segment (which is export oriented) contributes up to 85.7% (RM 731 million) of its revenue stream, with the balance 14.3% contributed by the packaging segment (RM 122 million).
MAGNI is listed under the Consumer Index, classified in the Process Industries - Containers/Packaging industry. Market capitalisation for MAGNI is about RM 680 million. Its FY starts in 30th April. Currently, it has just entered the 1st quarter for FY 2017. 2nd quarter results are expected sometime in December 2016.
Financial Brief and Ratios (Historical)
|
Magni-tech (7087.KL) |
Trailing Twelve Months (TTM) |
|
Revenue (RM’000) |
931,641 |
|
Net Earnings (RM’000) |
90,070 |
|
Net Profit Margin (%) |
9.67 |
|
EPS (sen) |
55.35 |
|
PE Ratio (PER) |
7.55 |
|
Dividend Yield (%) |
4.31 |
|
ROE (%) |
25.99 |
|
Cash Ratio |
0.833 |
|
Current Ratio |
3.16 |
|
Total Debt to Equity Ratio |
- |
Based on its revenue alone, MAGNI has managed to achieve CAGR of 14% for the past 5 financial years (2011 - 2016). This translates to a 36% CAGR for its corresponding net earnings. This growth pattern has been even more exponential these past 2 financial years, with y-o-y growth hitting up to 57%.
Based on the phenomenal growth in earnings, the PE ratio has also been brought in line to about 7, compared to a PE of 26 in FY 2011. This makes it considerably undervalued based on the PE ratio alone, provided it can maintain such high growth rates in the future.
Net profit margin on the other hand is average, considering the industry MAGNI is involved in. In terms of profitability, this goes without saying that management is doing a wonderful job, rewarding shareholders with an ROE of 26 and also dividend yields of 4.31%. MAGNI has been paying dividends annually as far back as 2004, with yields increasing especially since FY 2012. Dividend payout ratios are maintained at about 0.2 to 0.3, which is deemed prudent as the funds can be used to finance its growth.
In analysing its balance sheet and cash flows, MAGNI has favorable liquidity and gearing ratios. It is virtually debt free and generates free cash flow annually. Investors should keep track of increased inventories and receivables (a natural consequence of increased orders) reflected in their FY 2016 annual report. The group is also a beneficiary of MYR depreciation, and has locked in gains of RM 7 million from foreign exchange.
The garment and apparels industry is heavily depended on manual labor; this coupled with increase in minimum wage and short supply of workers will impact the bottom line. Based on the chairman’s statement in the FY 2016 annual report, MAGNI is committed to incorporating new technology in its production line to reduce dependence on manual workers. This capex is seen in the cashflow statement from RM 3 million in FY 2015 to RM 5 million in FY 2016.
iVolume Spread Analysis (iVSA) & comments based on iVSAChart software – Magni-tech
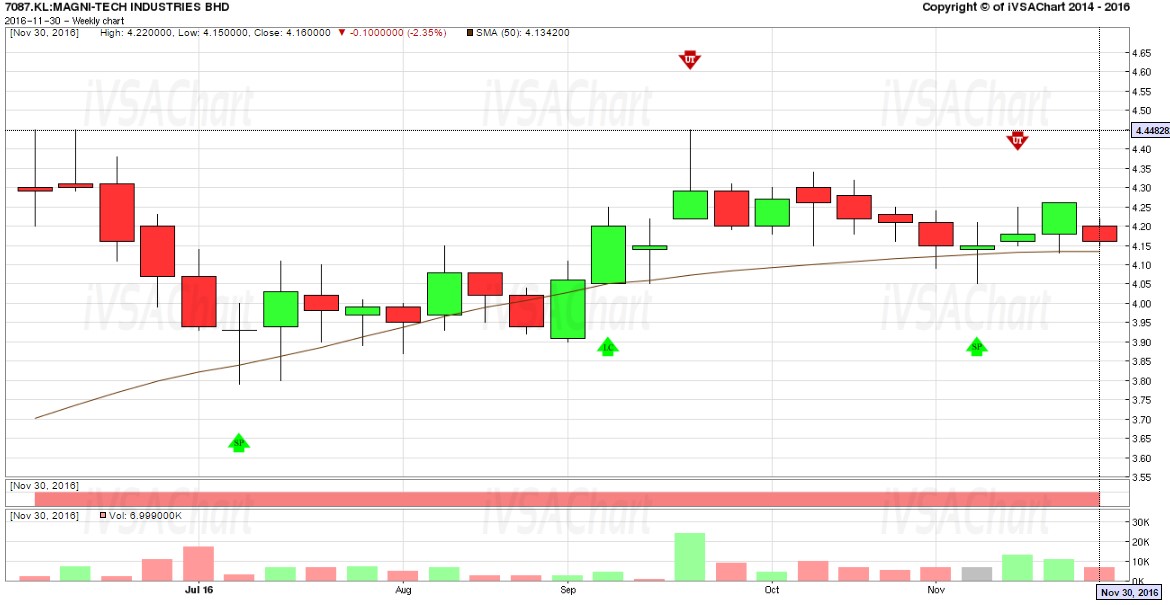
MAGNI has been ranging between RM 3.80 and RM 4.45 for the past 6 months. There was accumulation of stock around July to August 2016, with Sign Of Strength (green arrow) appearing in the 2nd week of July.
A relatively low volume but significant break out then took place in September with the appearance of another Sign Of Strength (green arrow), which led to MAGNI trading in a new, higher price range. This rising in price is likely coupled with the positive announcement of latest quarterly.
On 2nd week of Nov 2016, another Sign Of Strength (green arrow) appeared which suggests some strong hands supporting the stock at around RM 4.05 level. Aggressive investors with longer term view may consider accumulating this stock around support levels of RM 4.05 to RM4.10 or look out for emergence of more Signs Of Strength (green arrow) before taking position.
Interested to learn more?
- Free eBook available now! Click this URL to get your free eBook of “Get Rich with Dividends by Bill Wermine and Martin Wong”: http://ebook.ivsachart.com/
- Find out more about iVSAChart events via: https://www.ivsachart.com/events.php
- Follow & Like us on Facebook via: https://www.facebook.com/priceandvolumeinklse/
- Contact us via: email at sales@ivsachart.com or Call/WhatsApp at +6011 2125 8389/ +6018 286 9809/ +6019 645 3376
This article only serves as reference information and does not constitute a buy or sell call. Conduct your own research and assessment before deciding to buy or sell any stock. If you decide to buy or sell any stock, you are responsible for your own decision and associated risks.
Related Stocks
| Chart | Stock Name | Last | Change | Volume |
|---|
Market Buzz
More articles on iVSA Stock Review
Holistic View of Leon Huat with Fundamental Analysis & iVolume Spread Analysis (iVSAChart)
Created by Joe Cool | Dec 15, 2016
Holistic View of Tomypak with Fundamental Analysis & iVolume Spread Analysis (iVSAChart)
Created by Joe Cool | Dec 15, 2016
Holistic View of ECS IT with Fundamental Analysis & iVolume Spread Analysis (iVSAChart)
Created by Joe Cool | Dec 01, 2016
Holistic View of Teo Seng with Fundamental Analysis & iVolume Spread Analysis (iVSAChart)
Created by Joe Cool | Nov 14, 2016
Holistic View of QL Resources with Fundamental Analysis & iVolume Spread Analysis (iVSAChart)
Created by Joe Cool | Nov 03, 2016
Holistic View of Top Glove with Fundamental Analysis & iVolume Spread Analysis (iVSAChart)
Created by Joe Cool | Oct 24, 2016
Holistic View of Scientex with Fundamental Analysis & iVolume Spread Analysis (iVSAChart)
Created by Joe Cool | Oct 24, 2016
Holistic View of KESM with Fundamental Analysis & iVolume Spread Analysis (iVSAChart)
Created by Joe Cool | Oct 17, 2016
Discussions
Be the first to like this. Showing 0 of 0 comments
Post a Comment
Featured Posts
Introducing MY's First IPO Fund for Sophisticated Investors!
New Update. Discover investment communities that resonate with your ideas
M & A Value Partners IPO Equity Fund has been launched - Targeted 13% Return p.a
Latest Videos


Apps


Top Articles
1
Bursa Stock Musings - Thoughts & Ideas
PGF Capital - insti shareholding up from 5% to 14%! (part 1)
2
南洋行家论股
4
The Alpha Trader
5
Koon Yew Yin's Blog
6
How to become a resilient trader
7
RHB Investment Research Reports
8
BFM Podcast
#
Stock
Score
Daily Stocks
Stock Name
Last
Change
Volume
Stock Name
Last
Change
Volume
Featured Advertisers / Partners


Ride The Bull Short The Bear
CS Tan
4.9 / 5.0
This book is the result of the author's many years of experience and observation throughout his 26 years in the stockbroking industry. It was written for general public to learn to invest based on facts and not on fantasies or hearsay....