


iVSA Stock Review
Holistic View of Scientex with Fundamental Analysis & iVolume Spread Analysis (iVSAChart)

Can Scientex share price continues its uptrend?
Background and Core Business
Scientex Berhad ("Scientex") was incorporated in Malaysia under the Companies Act, 1965 as Scientific Textiles Industries Sdn. Bhd. to manufacture and market polyvinylchloride (PVC) leather cloth and sheeting. Scientex was converted to a public company in 1969. In 1990, Scientex was listed on the Main Market of the Kuala Lumpur Stock Exchange (now known as Bursa Malaysia Securities Berhad).
Scientex is now one of the world’s top three producers of industrial stretch film with an export market that covers more than 60 countries representing much of the industrialised world. It is also a leading player in manufacturing PP strapping bands; a market leader of consumer packaging products in Asia; a debutant in solar products; and a mainstay in the manufacture of component parts for automotive interior. Scientex is also on the top tier of property developers in Malaysia with integrated property projects spread over 1,935 acres of land in the southern states of Johor and Melaka.
Based on Financial Year (FY) 2016 full year ending July, Scientex achieved RM 2.2 billion turnovers, which is considered to be a large enterprise based on turnover value. Other aspects of the company’s latest financial results are illustrated in the table below.
|
Scientex (4731.KL) |
FY 2016 |
|
Revenue (RM’000) |
2,200,980 |
|
Net Earnings (RM’000) |
240,865 |
|
Net Profit Margin (%) |
10.94 |
|
Return of Equity (%) |
10.25 |
|
Total Debt to Equity Ratio |
0.41 |
|
Current Ratio |
1.07 |
|
Cash Ratio |
0.14 |
|
Dividend Yield (%) |
3.35 |
|
Earnings Per Share (Cent) |
52.36 |
|
PE Ratio |
12.55 |
Over the last 5 Financial Year (FY), Scientex’s revenue has a smooth increasing trend from RM 881 million in FY2012 to RM 2.2 billion in FY2016. This also translates to a growth of 2.75 times in 5 years or an average year to year growth of 25.78%.
Net profit wise, Scientex has an even remarkable smooth increase from RM 84 million in FY2012 to RM 240 million in FY2016. This represents a 2.85 times increase or an average year to year increase of 30% within the 5-financial year window.
In terms of net profit margin, Scientex scores an average 10.94% whereas Return On Equity (ROE) wise at 10.25%, which is also average.
On company’s debt, Scientex has a total debt to equity ratio at 0.41, meaning close to half of its company’s value are from long and short term borrowings. The company’s current ratio is an average 1.07 while cash ratio is not very healthy at 0.14 versus an acceptable value of 0.50
In terms of dividend, Scientex pays a higher than average 3.35% dividend yield at a low dividend payout ratio of 0.208.
In conclusion, Scientex is a large size enterprise with mixed fundamentals for having fantastic growth rates for both revenue and net profit over the past 5 years, but did not score well in terms of its balance sheets for having high gearing and low current and cash ratios.
The smooth uptrend of its share price is believed to be due to the strong growth of revenue and net profit, the weak balance sheet and current cash ratio of the company may be due to the property development sector of the company which requires high borrowing and requires cash for turnovers. Despite property market is likely to slow down for upcoming years, the revenue generated from this sector only contributes to 28% of the total company revenue as per FY2015. Hence in order to continue the revenue and net profit growth to support the share price uptrend, the company has to do well in their manufacturing sector, which its growth can get a push by the strengthening USD.
Next quarterly results announcement should be on the month of Dec 2016 for Q1 results.
iVolume Spread Analysis (iVSA) & comments based on iVSAChart software – Scientex
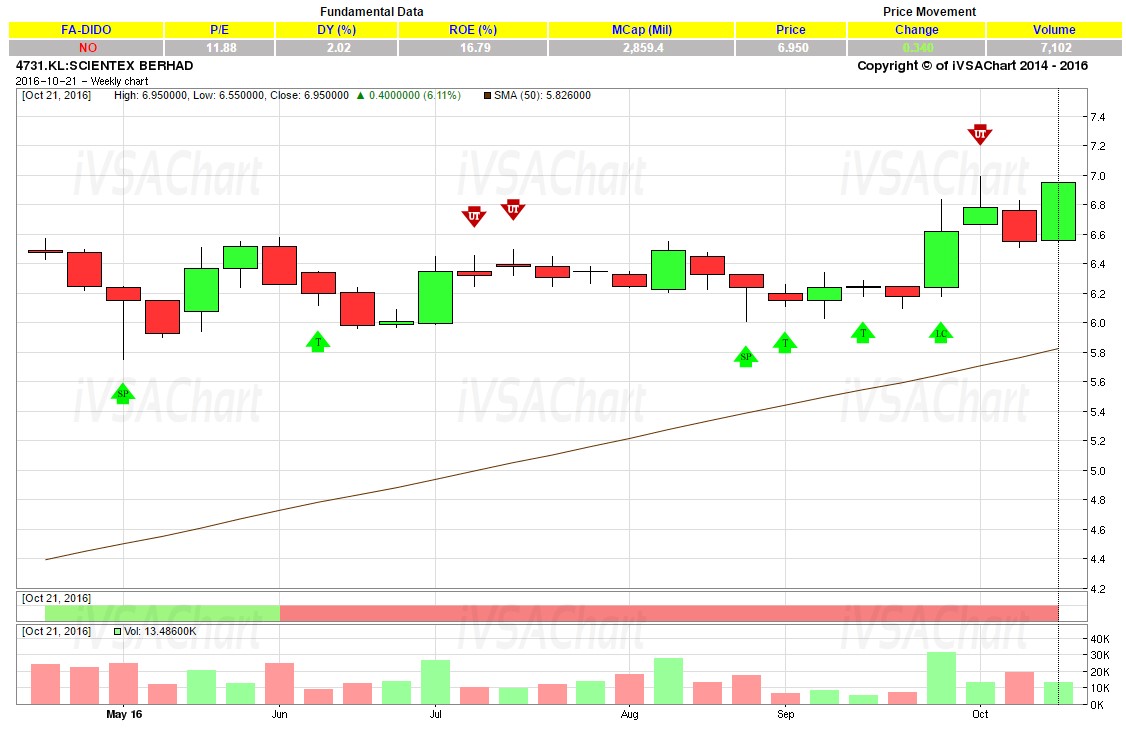
Based on Scientex 6-month weekly iVSAChart, it is noted that the market did very well to hold its share price around the RM6.20 to RM6.00 support levels. In addition, do observe that there were several Sign Of Strength (green arrow) detected, indicating hidden buying by smart money before successful breakout with accompanying volume around end Sept 2016.
The Scientex weekly chart is looking healthy and do expect more upside in mid- to longer-term until we see confirmed Sign Of Weakness (red arrow) in the iVSAChart for indication of trend reversal.
Interested to learn more?
- Free eBook available now! Click this URL to get your free eBook of “Get Rich with Dividends by Bill Wermine and Martin Wong”: http://ebook.ivsachart.com/
- Find out more about iVSAChart events via: https://www.ivsachart.com/events.php
- Follow & Like us on Facebook via: https://www.facebook.com/priceandvolumeinklse/
- Contact us via: email at sales@ivsachart.com or Call/WhatsApp at +6011 2125 8389/ +6018 286 9809/ +6019 645 3376
This article only serves as reference information and does not constitute a buy or sell call. Conduct your own research and assessment before deciding to buy or sell any stock. If you decide to buy or sell any stock, you are responsible for your own decision and associated risks.
Related Stocks
| Chart | Stock Name | Last | Change | Volume |
|---|
More articles on iVSA Stock Review
Holistic View of Leon Huat with Fundamental Analysis & iVolume Spread Analysis (iVSAChart)
Created by Joe Cool | Dec 15, 2016
Holistic View of Tomypak with Fundamental Analysis & iVolume Spread Analysis (iVSAChart)
Created by Joe Cool | Dec 15, 2016
Holistic View of ECS IT with Fundamental Analysis & iVolume Spread Analysis (iVSAChart)
Created by Joe Cool | Dec 01, 2016
Holistic View of Magni-Tech with Fundamental Analysis & iVolume Spread Analysis (iVSAChart)
Created by Joe Cool | Dec 01, 2016
Holistic View of Teo Seng with Fundamental Analysis & iVolume Spread Analysis (iVSAChart)
Created by Joe Cool | Nov 14, 2016
Holistic View of QL Resources with Fundamental Analysis & iVolume Spread Analysis (iVSAChart)
Created by Joe Cool | Nov 03, 2016
Holistic View of Top Glove with Fundamental Analysis & iVolume Spread Analysis (iVSAChart)
Created by Joe Cool | Oct 24, 2016
Holistic View of KESM with Fundamental Analysis & iVolume Spread Analysis (iVSAChart)
Created by Joe Cool | Oct 17, 2016
Discussions
Be the first to like this. Showing 0 of 0 comments
Post a Comment
Featured Posts


Latest Videos

Apps


Top Articles
1
Bursa Stock Musings - Thoughts & Ideas
PGF Capital - insti shareholding up from 5% to 14%! (part 1)
2
南洋行家论股
4
The Alpha Trader
5
Koon Yew Yin's Blog
6
How to become a resilient trader
7
RHB Investment Research Reports
8
BFM Podcast
#
Stock
Score
Daily Stocks
Stock Name
Last
Change
Volume
Stock Name
Last
Change
Volume
Stock Name
Last
Change
Volume
Featured Advertisers / Partners


Ride The Bull Short The Bear
CS Tan
4.9 / 5.0
This book is the result of the author's many years of experience and observation throughout his 26 years in the stockbroking industry. It was written for general public to learn to invest based on facts and not on fantasies or hearsay....