


iVSA Stock Review
Holistic View of Tomypak with Fundamental Analysis & iVolume Spread Analysis (iVSAChart)

Will Tomypak Rebound from the Downtrend Since Early 2016?
Tomypak Berhad is one of the leading converter for flexible food packaging materials in Malaysia. It has been established in 1979 and listed on the Main Market of Bursa Malaysia since 1996. The company have received the 1st HACCP certified Flexible Packaging Materials Manufacturing Company in Malaysia since 2003.
It showed progressive growth and aggressive technology enhancement over time to ensure efficiency of manufacturing process, consistent product quality for customer satisfaction. The company implement the Technology Transfer from Rexam Technologies and Sharing of Technical Know How for developing high barrier vacuum metallised laminates.
Based on Financial Year (FY) 2015 full year results, Tomypak achieved RM 214 million turnover, which is considered to be a small to mid-size enterprise based on turnover value. Other aspects of the company’s latest financial results are illustrated in the table below.
|
Tomypak (7285.KL) |
FY 2015 |
TTM (Sep 2016) |
|
Revenue (RM’000) |
214,099 |
216,189 |
|
Net Earnings (RM’000) |
23,162 |
18,101 |
|
Net Profit Margin (%) |
10.82 |
8.37 |
|
Return of Equity (%) |
18.40 |
9.75 |
|
Total Debt to Equity Ratio |
0.24 |
0.12 |
|
Current Ratio |
2.16 |
3.82 |
|
Cash Ratio |
0.24 |
1.27 |
|
Dividend Yield (%) |
6.06 |
7.07 |
|
Earnings Per Share (Cent) |
21.16 |
11.02 |
|
PE Ratio |
7.80 |
14.97 |
Over the latest past 5 Financial Year (FY), Tomypak’s revenue has its ups and down but in general increased only slightly from RM 212 million in FY2011 to RM 214 million in FY2015. Tomypak’s highest revenue was achieved in FY2013 at RM224 million.
In terms of net earnings, Tomypak has doubled its net earnings within 5 years, from RM 11 million in FY2011 to RM 23 million in FY 2015. Having a relatively stagnant revenue but with a 100% increase in net profit within 5 years shows that the company focuses on margin improvements by driving the financial cost down each year but did not manage to increase market share.
Net profit margin wise, Tomypak scores a 10.82%, which is a slightly above average score for a manufacturing company. For Return On Equity (ROE), Tomypak performs well by achieving 18.40%.
On company’s debt, Tomypak has an acceptable debt to equity ratio at 0.24, meaning 24% of the company’s value is made up of current and long term liabilities. The company’s current ratio is great at 2.16 but cash ratio is at a unhealthy value of 0.24. Companies with good financial usually keeps their cash ratio above 0.5 unless their inventory are for goods with high liquidity. However, do note that the cash ratio has improved to 1.27 in the latest TTM results.
Tomypak is outstanding in terms of dividend by paying a higher than average 6.06% dividend yield follow by an acceptable dividend payout ratio at 0.55.
In conclusion, Tomypak is a small to mid-size enterprise with good fundamentals and strong in increasing company’s net profit through driving down financial cost despite having a stagnant revenue, as well as paying very high dividend yield to shareholders.
The share price downtrend since the beginning of year 2016 might be due to the unfavorable outlook for FY2016 financial results. As seen from the table above, it is forecasted that Tomypak will have a slight increase in revenue but decrease in net profit for FY2016. Moreover, the weak sentiments among Malaysia consumers which contributes to half of Tomypak’s revenue further supports the poor FY2016 financial outlook.
In order for Tomypak to rebound, the company has to show signs of increasing revenue along with good earnings as there is a limit to increasing net profit solely through cost reduction.
Next quarterly results announcement should be on the month of Feb 2017 for Q4 results.
iVolume Spread Analysis (iVSA) & comments based on iVSAChart software – Tomypak
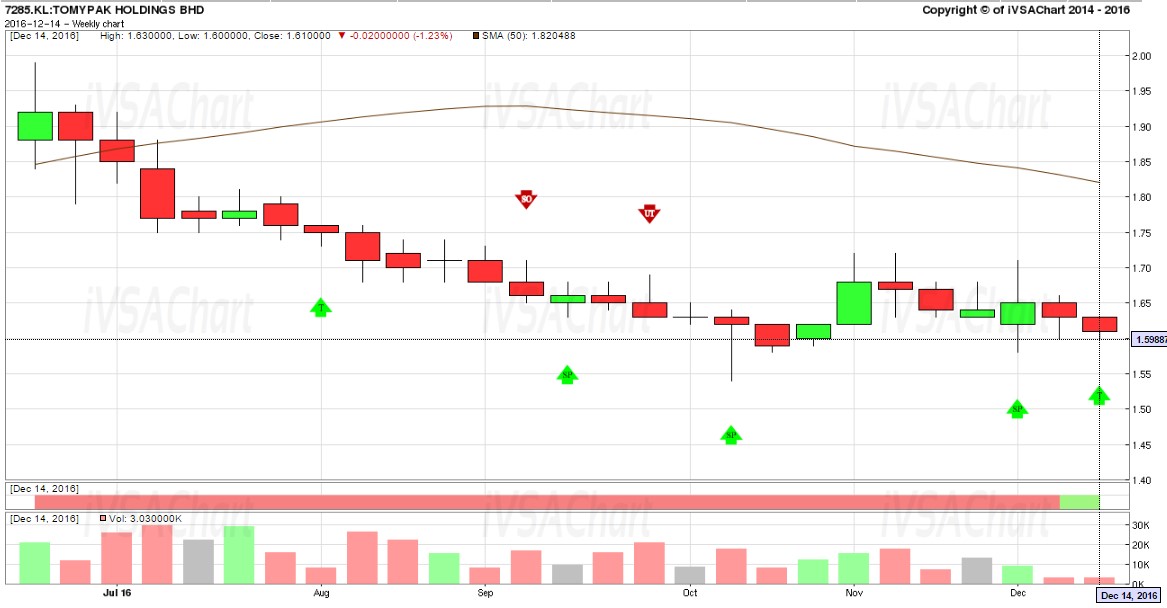
On this 6-month weekly iVSAChart, TomyPak has built a beautiful base level, with accumulation since Oct 2016. The emergence of Sign Of Strength (green arrow) since Oct 2016 along with strong support around RM1.60 indicates there are signs of hidden buying by smart money to support the stock around this level.
With dividend yield at 6% for company with good fundamentals, this stock should be part of the portfolio for investors with longer term view and they should consider accumulating around current levels, given that there is low risk with strong support around RM1.60, along with Sign Of Strength (green arrow) detected and a strong background for this chart from iVolume Spread Analysis perspective.
Interested to learn more?
- Free eBook available now! Click this URL to get your free eBook of “Get Rich with Dividends by Bill Wermine and Martin Wong”: http://ebook.ivsachart.com/
- Find out more about iVSAChart events via: https://www.ivsachart.com/events.php
- Follow & Like us on Facebook via: https://www.facebook.com/priceandvolumeinklse/
- Contact us via: email at sales@ivsachart.com or Call/WhatsApp at +6011 2125 8389/ +6018 286 9809/ +6019 645 3376
This article only serves as reference information and does not constitute a buy or sell call. Conduct your own research and assessment before deciding to buy or sell any stock. If you decide to buy or sell any stock, you are responsible for your own decision and associated risks.
Related Stocks
| Chart | Stock Name | Last | Change | Volume |
|---|
Market Buzz
More articles on iVSA Stock Review
Holistic View of Leon Huat with Fundamental Analysis & iVolume Spread Analysis (iVSAChart)
Created by Joe Cool | Dec 15, 2016
Holistic View of ECS IT with Fundamental Analysis & iVolume Spread Analysis (iVSAChart)
Created by Joe Cool | Dec 01, 2016
Holistic View of Magni-Tech with Fundamental Analysis & iVolume Spread Analysis (iVSAChart)
Created by Joe Cool | Dec 01, 2016
Holistic View of Teo Seng with Fundamental Analysis & iVolume Spread Analysis (iVSAChart)
Created by Joe Cool | Nov 14, 2016
Holistic View of QL Resources with Fundamental Analysis & iVolume Spread Analysis (iVSAChart)
Created by Joe Cool | Nov 03, 2016
Holistic View of Top Glove with Fundamental Analysis & iVolume Spread Analysis (iVSAChart)
Created by Joe Cool | Oct 24, 2016
Holistic View of Scientex with Fundamental Analysis & iVolume Spread Analysis (iVSAChart)
Created by Joe Cool | Oct 24, 2016
Holistic View of KESM with Fundamental Analysis & iVolume Spread Analysis (iVSAChart)
Created by Joe Cool | Oct 17, 2016
Discussions
Be the first to like this. Showing 0 of 0 comments
Post a Comment
Featured Posts
Introducing MY's First IPO Fund for Sophisticated Investors!
New Update. Discover investment communities that resonate with your ideas
M & A Value Partners IPO Equity Fund has been launched - Targeted 13% Return p.a
Latest Videos


Apps


Top Articles
1
Bursa Stock Musings - Thoughts & Ideas
PGF Capital - insti shareholding up from 5% to 14%! (part 1)
2
南洋行家论股
4
The Alpha Trader
5
Koon Yew Yin's Blog
6
How to become a resilient trader
7
RHB Investment Research Reports
8
BFM Podcast
#
Stock
Score
Daily Stocks
Stock Name
Last
Change
Volume
Stock Name
Last
Change
Volume
Stock Name
Last
Change
Volume
Featured Advertisers / Partners


Ride The Bull Short The Bear
CS Tan
4.9 / 5.0
This book is the result of the author's many years of experience and observation throughout his 26 years in the stockbroking industry. It was written for general public to learn to invest based on facts and not on fantasies or hearsay....