


Koon Yew Yin's Blog
Charting: How a novice can use chart - Koon Yew Yin

Koon Yew Yin
Publish date: Mon, 28 Apr 2014, 10:13 PM
Koon Yew Yin
0 1,434
An official blog in i3investor to publish sharing by Mr. Koon Yew Yin.
All materials published here are prepared by Mr. Koon Yew Yin
All materials published here are prepared by Mr. Koon Yew Yin
Koon yew Yin
Introduction
First I must tell you that I am not a professional Chartist and I only use the chart to help me make decision to buy, hold or sell.
The two methods commonly used to analyze securities and make investment decisions are fundamental analysis and technical analysis. Fundamental analysis involves analyzing the characteristics of a company in order to estimate its value. Technical analysis takes a completely different approach; it doesn't care one bit about the "value" of a company. Chartists are only interested in the price movements in the market.
Despite all the fancy and exotic tools it employs, technical analysis really just studies supply and demand in a market in an attempt to determine what direction, or trend, will continue in the future. In other words, technical analysis attempts to understand the emotions in the market by studying the market itself, as opposed to its components. If you understand the benefits and limitations of technical analysis, it can give you a new set of tools or skills that will enable you to be a better trader or investor.
You can use technical analysis to:
1. Identify profitable stock patterns
2. Minimize your risk
3. Maximize your return in up and down markets
You’ll learn how to make big money on stocks using a technical analysis toolkit that has been wielded successfully for hundreds of years. That’s no exaggeration.
That makes these patterns some of the most time-tested strategies in finance. You can feel secure that you are trusting your investments to a highly refined system – not a new craze or an analyst’s hunch.
There are hundreds of patterns in stock charts that traders can look for, but I will only tell what is most trusted and reliable.
The Symmetrical Triangle: A Reliable Workhorse
You’ll recognize the symmetrical triangle pattern when you see a stock’s price vacillating up and down and converging towards a single point. Its back and forth oscillations will become smaller and smaller until the stock reaches a critical price, breaks out of the pattern, and moves drastically up or down.
The symmetrical triangle pattern is formed when investors are unsure of a stock’s value. Once the pattern is broken, investors jump on the bandwagon, shooting the stock price north or south.
Symmetrical Triangle Pattern
To form your symmetrical triangle pattern, draw two converging trendlines that bound the high and low prices. Your trendlines should form (you guessed it) a symmetrical triangle, lying on its side.

How to Profit from Symmetrical Triangles
Symmetrical triangles are very reliable. You can profit from upwards or downwards breakouts. You’ll learn more about how to earn from downtrends when we talk about maximizing profits.
If you see a symmetrical triangle forming, watch it closely. The sooner you catch the breakout, the more money you stand to make.
Watch For:
Sideways movement, a period of rest, before the breakout.
Price of the asset traveling between two converging trendlines.
Breakout ¾ of the way to the apex.
Set Your Target Price:
As with all patterns, knowing when to get out is as important as knowing when to get in. Your target price is the safest time to sell, even if it looks like the trend may be continuing.
For symmetrical triangles, sell your stock at a target price of:
Entry price plus the pattern’s height for an upward breakout.
Entry price minus the pattern’s height for a downward breakout.
Note: As this article is getting too long, I will post another article on how I use chart later.
More articles on Koon Yew Yin's Blog

Why do people riot? - Koon Yew Yin
Created by Koon Yew Yin | Aug 19, 2024
On 14th Aug 2024, I posted my article “Why people are rioting across UK”. Now I want to tell you why do people riot?

How much do our MPs and assemblymen earn? - Koon Yew Yin
Created by Koon Yew Yin | Aug 19, 2024
If I knew politicians are so well paid, I should have been a politician. A few days ago, one old friend who migrated to Australia about 40 years ago, visited me. He told me that he was a Member of P..

Why are people rioting across UK? - Koon Yew Yin
Created by Koon Yew Yin | Aug 14, 2024
Riots have spread across numerous cities and towns in England, and in Belfast in Northern Ireland, over the last week in the worst outbreak of civil disorder in Britain for 13 years. Police have ma...

Can Harris beat Trump? - Koon Yew Yin
Created by Koon Yew Yin | Jul 30, 2024
The new poll, conducted between July 22-24 and released Sunday, found that Harris’s approval rating had surpassed Trump’s in Wisconsin, Pennsylvania, Minnesota, and Michigan. In Michigan, Harris was..
A few people are using my name to cheat people - Koon Yew Yin
Created by Koon Yew Yin | Jul 30, 2024
As you can see below, a few people are using my name to promote sale of Initial Public Offer (IPO) shares before and after listing on Bursa Malaysia. You should not buy IPO shares because statistics..
KSL passed TA and FA - Koon Yew Yin
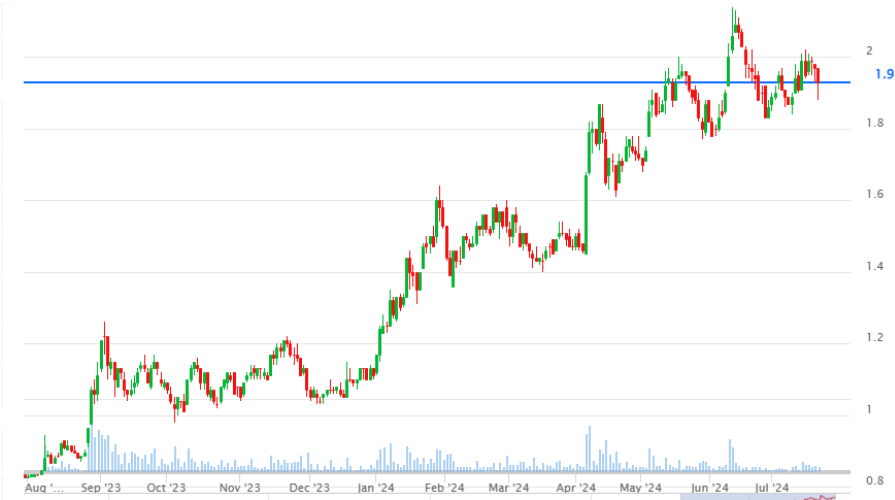
Created by Koon Yew Yin | Jul 23, 2024
The most important criteria for share selection are technical analysis and financial analysis. The price chart below shows that KSL's share price has been going up from 88 sen to above RM 2.13...
KSL is cheapest property stock - Koon Yew Yin
Created by Koon Yew Yin | Jul 22, 2024
Recently one smart accountant pointed out to me that KP Property has millions of Redeemable Convertible Preference Shares (RCPS). This will affect its share price. I sold all my KPP shares to buy KSL.
Why Malaysians must learn Mandarin? - Koon Yew Yin
Created by Koon Yew Yin | Jul 15, 2024
Currently Bahasa Melayu is taught in all Government sponsored schools. Bahasa Melayu is only good within Malaysia. All our overseas customers do not know Bahasa Melayu. I hope all our politicians...


‘TRY TO REMEMBER’: A Tribute Concert To Chin Yoong Kim - Koon Yew Yin
Created by Koon Yew Yin | Jul 09, 2024
Discussions
9 people like this. Showing 20 of 20 comments
Wow uncle koon this is one article that impress me most. It is heartening to see a successful fundamental investor having an open mind to absorb technical info. Maybe I should also start writing about what learn about technical !
Well done (100 times !!!)
2014-04-29 07:20
Thank you very much Mr Koon for sharing this. Very valuable for beginners like me.
2014-04-29 08:33
CheongKOK, I cannot find BDB, is it a listed company? If I cannot find it easily, how do you expect investors to buy it? I am not interested any more. I do not wish to waste my time
2014-04-29 19:03
total debt (340 million) > revenue (280 million), though most debt is long term
Bina Darulaman Berhad (BDB) is Malaysia-based company engaged in investment holding, provision of management services, oil palm plantation and property development. The Company, through its subsidiaries, operates in five segments: property development, which include the development of residential and commercial properties; quarrying and road paving work, which is engaged as granite quarry operator and civil engineering contractor; construction, which is engaged as building and general contractor; operation of golf resort and hotel, on which it owns a golf resort and operates a hotel, and trading of consumables. The Company's subsidiaries are Kedah Holdings Sdn. Bhd., BDB Construction Sdn. Bhd., BDB Quarry Sdn. Bhd., BDB Hotels Sdn. Bhd., Daraluman Asset Sdn. Bhd., Jitra Waterworld Sdn. Bhd., BDB Trading Sdn Bhd., and PT Darulaman.
2014-04-29 20:40
Uncle Koon, can you please advice on L&G stock. I am new to stock trading and had brought quite a lot on this stock a few days ago. Thanks you.
2014-04-29 21:11
Good video clips on Value Growth Investing. Also talked and briefly discussed were the Technical Analysis. 1. http://www.youtube.com/watch?v=8Ul0ciJOUvY 2. http://www.youtube.com/watch?v=lFcFE_jXy3c
2014-04-29 23:26
As I observe Gmutual and Mkland has form Symmetrical Triangles. Both are properties stock.
2014-04-30 10:27
Post a Comment
Featured Posts
Introducing MY's First IPO Fund for Sophisticated Investors!
New Update. Discover investment communities that resonate with your ideas
M & A Value Partners IPO Equity Fund has been launched - Targeted 13% Return p.a
Latest Videos

.png)


Apps


Top Articles
1
2
The Alpha Trader
3
save malaysia!
4
Good Articles to Share
'Things will get worse' — PM Starmer says fixing UK problems will take time
5
Good Articles to Share
US Fed mortgage bond holdings play 'central' policy rule, paper says
6
Good Articles to Share
25-year-olds are running Kamala Harris’ social media campaign: Report
7
Good Articles to Share
SpaceX to return Boeing's Starliner astronauts from space next year
8
Good Articles to Share
Commuting in a kayak a breath of fresh air for Shanghai office worker
#
Stock
Score
Daily Stocks
Stock Name
Last
Change
Volume
Stock Name
Last
Change
Volume
Stock Name
Last
Change
Volume
MQ Trading Signals
Stock
Time
Signal
Duration
No trading signals available.
Stock
Time
Signal
Duration
No trading signals available.
Featured Advertisers / Partners


Ride The Bull Short The Bear
CS Tan
4.9 / 5.0
This book is the result of the author's many years of experience and observation throughout his 26 years in the stockbroking industry. It was written for general public to learn to invest based on facts and not on fantasies or hearsay....
nsk82
live to learn, bravo Uncle Koon :)
2014-04-28 22:18