


Davidtslim sharing
TAWIN: A Turnaround Company with Capacity expansion with Vertically integrating to downstream Biz (Davidtslim)

Summary:
- Ta Win Holdings Bhd is an investment holding company, which is principally in the business of manufacturing and sales of copper wires and copper rods. Ta Win is a leading Malaysian copper manufacturer listed on Bursa Malaysia with revenues in excess of RM370 million a year.
- The demand for its products - copper wire and cable - is on the rise due to global digitisation, affecting many industries including infrastructure, transportation, and energy. (Copper helps reduce CO2 emissions and lowers the amount of energy needed to produce electricity. Copper is one of the best renewable resources. It is also one of the few materials that can be recycled 100% over and over again without a loss in performance)
- Renewable energy (solar) require up to 5x more copper than traditional energy sources. Electric cars requires 5x more copper than conventional cars (https://issues.solarindustrymag.com/article/rise-solar-unique-opportunity-copper, https://en.wikipedia.org/wiki/Copper_in_renewable_energy).
- Ta Win’s profitability is more dependent on the efficiency of their machines and cost control measures, not too much on the international copper price. The price of copper has varied from USD5600 to 6500+ per tons over the past 5 (reference price from LME, London Metal Exchange) while their past 12 months result still loss making. There is some effect on the fluctuation in copper prices to the company profitability but this is offset somewhat by back-to-back orders of the raw materials and products.
- Through an international JV, Ta Win has entered the Chinese copper market and the Malaysian copper recycling market. This JV comes in good time as I expects Tawin to benefit from China’s move to clamp down on scrap copper imports starting from 2018, making the conditions more stringent in 2019 (refer to 1. https://www.reuters.com/article/us-china-metals-scrap/chinas-scrap-metal-imports-to-slump-as-new-rules-leave-firms-confused-idUSKCN1SP0T2), (2. https://asia.nikkei.com/Business/Energy/China-storms-past-US-and-Japan-to-take-lead-in-wind-and-solar-power).
- Through a local JV, Ta Win has made a move downstream into the high-margin cable industry with a patented formula to improve profit margin as downstream normally command a higher margin.
- Ta Win is expanding its capacity (through new production lines) and is vertically integrating to attain higher margins.
- Through an international JV, Ta Win has entered the Chinese copper market and the Malaysian copper recycling market.
- By investing into new businesses with higher margins, Ta Win is positioning itself for a sustainable profitable growth (as new production lines have already commissioned in May 2019 and started commercial run in July 2019).
- With new production lines, the Group’s total capacity could be doubled (increase to 2000-2200 metric tons per month from 1000-1200 tons - with higher margin from the new production lines)
- Introduction
Renewable energy sources such as solar, wind, and hydro have become an alternative energy source of the energy market (including Malaysia’s strong push for renewable energy). The rapid growth of renewable energy in the past 5 years was prompted by the increasing costs of fossil fuels as well as their environmental impact issues. Copper plays an important role in these renewable energy systems. In fact, copper usage averages up to five times more in renewable energy systems than in traditional power generation, such as fossil fuel and nuclear. Since copper is an excellent thermal and electrical conductor among the engineering metals, power systems that utilise copper generate and transmit energy with high efficiency and with minimum environmental impacts.
Copper is among the Best Conductors of Electricity and Heat, so it is hardly surprising that about 60% of Total Copper Use is for these Applications
- Electricity and Energy
- Wire and Cables
- Busbars (Busbars are robust conductors that function as electrical manifolds to distribute power from a single source to several users)
- Transformer and Motor Windings
- Electronic Equipment
- Other Electrical Engineering Uses
-
Renewables
-
Solar Heating
- high heat conductivity, resistance to atmospheric and aqueous corrosion, ease of fabrication, mechanical strength and longevity offer strong advantages over any other material in solar heating applications. -
Wind
- The primary use of copper in wind energy technologies is in the coil windings in the stator and rotor portions of the generator, in the high-voltage power cable conductors, transformer coils and earthing. -
Photovoltaics (solar panel, refer to appendix No 2 and 3)
Copper forms part of the materials presently used for photovoltaic solar cells, in the technology’s cabling, earthing, inverter, transformers and photovoltaic cell ribbons.
-
Solar Heating
- Regarding the sustainability of renewable energy systems, it is worth to note that copper can be recycled 100 percent over and over again without a loss in performance.
- Turnaround Story
Tawin has been in loss making position over the past 18 months (4 loss making quarters over last 6 quarters but already turned profitable with 8.1mil net profit in the latest quarter result released on 30 August). The reasons of loss making are due to the following reasons:
- Existing old machines (more than 20 years) which incur higher costs associated with equipment downtime and maintenance.
- Higher administrative expenses (one-off) incurred as a result of the fair value loss on derivative liability and the Group's on-going corporate exercise (completed this exercise in August 2019).
- Thin profit margin due to their high cost of their copper raw material (cathode). If they can use recycled copper raw material in their production process, then their profit margin could be higher (due to lower raw material cost).
Four (4) Keys of turnaround
2.1 New Machines could contribute higher margin (no 1)
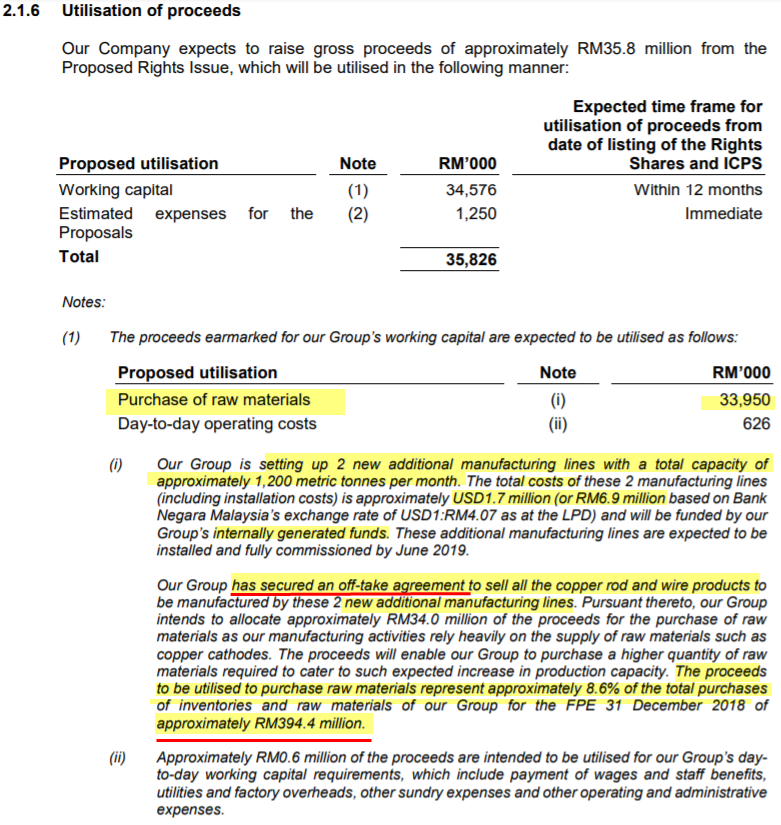
One of their strategies to turnaround from loss to profitability is by changing the old machines to newer and more efficient machines, which can accept recycled raw materials (or lower purity copper raw material). For this purpose, Tawin has proposed right issue and ICPS (irredeemable convertible preference shares) to raise RM35.8 mil (mainly to buy raw materials). This corporate exercise has been completed in August 2019. Let see the details of the right issue fund utilization as below (circular 2.1.6):
Source: https://malaysiastock.biz/Company-Announcement.aspx?id=1125272 (circular of right issue dated March 2019.
From the above circular, 2 new additional manufacturing lines with a total capacity of approximately 1200 metric tons per month has been setup. The total costs of these 2 manufacturing lines (including installation costs) is approximately USD1.7 million (or RM6.9 million based on exchange rate of 4.07). Personally I expect these two new productions lines will have higher efficiency and profit margin and the best thing is the has secured an off-take agreement to sell all the copper rod and wire products of this new production lines.
Remember their existing production lines total capacity is approximately 1000 tons (per month) with revenue per quarter of about 90mil. With the contribution of the new production lines, capacity could increase to 2000 tons per month with possible double up of revenue (higher margin from new production lines).
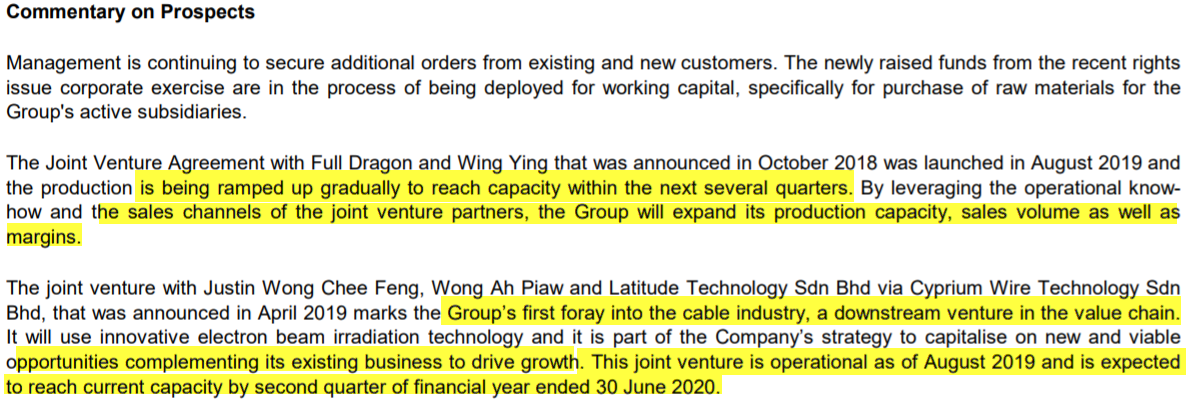
2.2 Cyprium Wire Technology JV (no 2)
Cyprium JV was announced in April 2019 marks Tawin first foray into the cable industry, a downstream venture in the value chain which normally command a double digit net profit margin. It will use innovative electron beam irradiation technology (patented) and it is part of the Company’s strategy to capitalise on new and viable opportunities complementing its existing business to drive growth. This joint venture is expected to be operational as of in 3rd quarter in July – August 2019 (Q3 could contribute)
With 80% ownership of the newly set up Cyprium Wire Technology SB, TaWin is the first and only Malaysian company to commercialize this technology. The competitive pricing and lead time as compared to foreign competitors are some key advantages of this downstream product.
2.3 Increase export ratio (no 3)
Tawin has increased their local and export market ratio from 80:20 to 60:40 level in 2019. Their target is further increase this ratio to level of 50:50 to ensure that the company continues to grow and can have a more natural hedge of their currency risk.
2.4 Internal Operations Improvement (no 4)
Tawin has designed a capex plan to replace old machinery in order to improve efficiencies on electricity cost, labour cost, and maintenance cost.
Finally, let us go through the prospects of Tawin (last two quarters) as below:
Source: Report of 2Q2019 (released 30 Aug 2019)
Valuation – With a more efficient new productions lines, international and local JV, Ta Win has expanding into new markets and vertically integrating to downstream business to attain higher margins with a patented technology.
The estimated FY2020 (July 2019-June 2020) profit and fair value is shown in table below:
|
|
Estimated revenue (mil) |
FY2020 (July 2019 to Jun 2020) (net margin) (mil) |
FY2021 (July 2020 to Jun 2021) (net margin) (mil) |
FY2022 (July 2021 to Jun 2022) (net margin) (mil) |
|
Core Business |
400 |
4 (1.0 % net margin) |
6 (1.5 % net margin with new machine replacement) |
6 (1.5 % net margin with new machine replacement) |
|
TaWin Copper, International JV (new production lines with off-take agreement) |
250 |
6.25 (2.5 % net margin) |
7.5 (2.5 % net margin on 300 mil revenue) |
10 (2.5 % net margin on 400 mil revenue) |
|
Cyprium (local JV, downstream biz for automative)0 |
30 for 2019 |
3 (10% net margin) |
4 (10% net margin on 40 mil revenue) |
4 (10% net margin) |
|
Total (mil) |
680 |
13.25 |
17.5 |
20 |
|
EPS (based on 348mil shares base), ~30mil PA already converted (~7% PA share converted) |
- |
3.8 sen |
5.2 sen |
5.8 sen |
|
6x PE (assume no further dilution as now PA no much discount now due to need to add 7.5 sen) |
- |
23 sen (considered 7% PA dilution) |
21 sen (40% dilution) |
23 sen (40% dilution) |
|
7x PE(assume no dilution) |
- |
26.6 sen (considered 7% PA dilution) |
24 sen (40% dilution) |
26.3 sen (40% dilution) |
|
8x PE (with 20% PA shares dilution) --> total share base = 411mil |
- |
26 sen (20% dilution) |
34 sen (20% dilution) 28 sen (40% dilution)
|
37.2 sen (20% dilution)
|
Tawin-PA share conversion and dilution analysis
|
Total Outstanding Tawin-PA shares |
417 mil (due to 30 mil already converted) |
|
Conversion option |
4 PA for 1 mother or 1 PA+7.5 sen |
|
Assuming 40% of PA holders converted using cash of 7.5 sen+ 1PA (about 30-40% PA shares are in Management hand which are not likely to be converted in short term) |
Company will receive 186mil X 0.075 = 14 mil cash (big cash position considering its small market cap |
|
Ex-cash FY2020 PE (assuming company receive 14 mil cash from PA conversion) (To calculate the PE (ex cash), subtract Cash from the market value before dividing by earnings) |
PE (ex-cash) = 3.9x (at 13 sen price and assuming 40% dilution from PA) the warrant is expected to be out of money hence no dilution is expected in the next 12 months (unless price of Tawin can reach 20 sen). |
Summary of the latest quarter result:
Tawin's new production lines started in May 2019 - on a trial run basis. Production will be ramping up gradually and better results should be shown in the new few quarters, starting next quarter Q3 2019 calendar year. With new production lines and better efficiency, it has started to show some improvements even in this quarterly result (Q2) (excluding the one-off disposal gain) as follows:-
1. Revenue went up by more than 20% compared to previous quarter. (Higher production)
2. Gross margin went up to 1.8% from 0.7% in previous quarter. (Better efficiency + lower cost of raw mat)
3. Lower admin expenses went down to RM1.5 million from RM3.2 million. (Better efficiency)
They're running a high revenue base with thin profit margin business. Should they further improve their efficiency and moving into higher margin products (which they have already started doing), from their existing 1% profit margin to 2% profit margin, the profit would have gone up by 100%.
Current Business
Core Business - 1% net margin
Venture into Higher Margin Products Business
Copper JV Business - 2.5% net margin estimated (started production in July or Aug 2019)
Cyprium cable downstream Business - 10% net margin estimated (started production in August 2019)
Risk:
- Unplanned Machine breakdown
- Escalated Trade war that affect the demands of copper internationally
Price Chart
Current price of Tawin is trading at near 52 weeks low (12 sen) and if they can turnaround in 2H of 2019, then downside is limited due to I expect is it likely to turnaround based on their new JVs (international and local) and internal efficiency improvement.
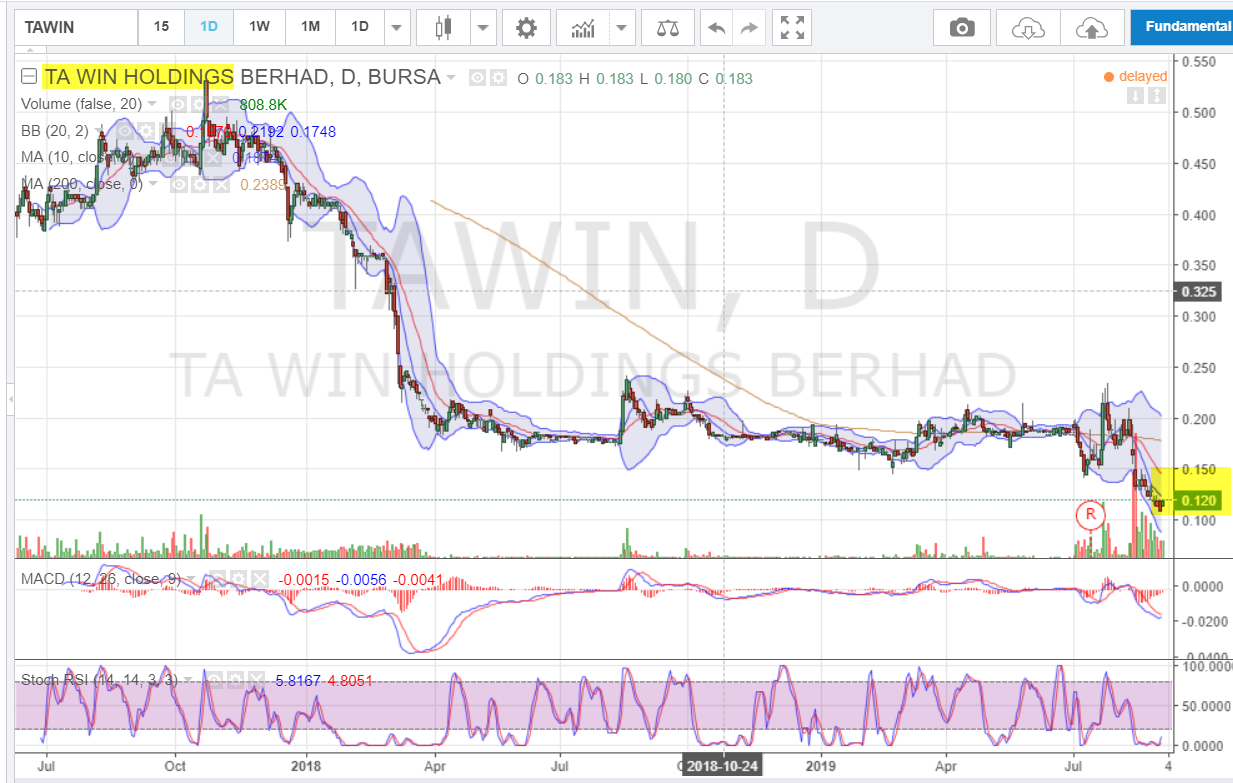
The new management taken over the company since end of year 2017 when tawin was still trading at 1.00 (after adjusted price still about 35-38 sen now).
One good example of successful turnaround play is MFLOUR. When Mflour proposing right issue, LA with free warrant time (Dec 2018), its share price dropped from RM1.1 to 45 sen, then after it turnaround in Feb 2019 and May 2019 results, its share price rebounded to above 60 sen.
(Mflour: Renounceable rights issue of up to RM165,085,617 in nominal value of 5-year 5% redeemable convertible unsecured loan stocks ("RCULS") at 100% of its nominal value of RM1.00 on the basis of 3 RCULS for every 10 existing ordinary shares of Malayan Flour Mills Berhad ("MFLOUR" or "Company") ("MFLOUR Shares" or "Shares") held as at 5.00 p.m. on 27 December 2018 together with up to 82,542,808 new MFLOUR Shares ("Bonus Shares A") on the basis of 1 Bonus Share A for every 2 RCULS subscribed and up to 82,542,808 free detachable warrants)
If you interested on my analysis report, please contact me at davidlimtsi3@gmail.com
You can get my latest update on share analysis at Telegram Channel ==> https://t.me/davidshare
Disclaimer:
This writing is based on my own assumptions and estimations. It is strictly for sharing purpose, not a buy or sell call of the company and the contents of this report should not be considered as professional financial investment advises or buy/sell recommendations. I strongly encourage you to do your own research and take independent financial advice from a professional before you proceed to invest.
I make no representations as to the accuracy, completeness, correctness, suitability, or validity of any information on my report and will not be liable for any errors, omissions, or delay in this information or any losses and damages arising from its display or usage. All users should read the posts and analysis the information at their own risk and we shall not be held liable for any losses and damages.
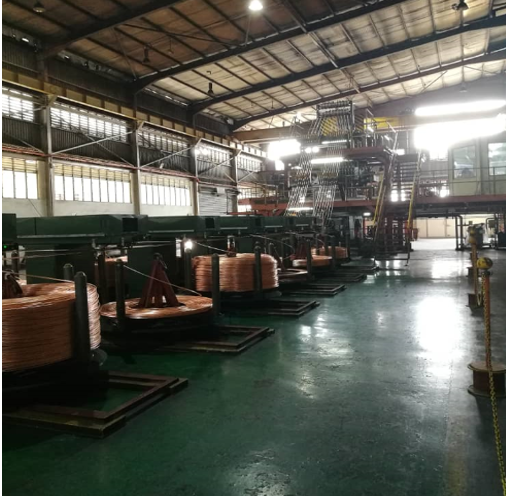
Appendix:
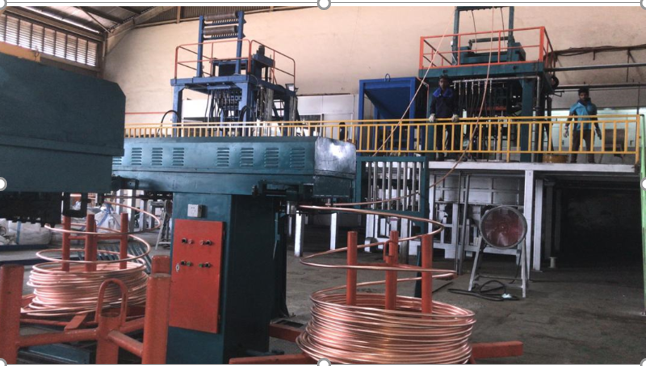
- Factory visit Photo
New production lines, international JV (Trial Run in May and June)
Production of Old production lines (still running)

Old production line (old machine)
- Recently government has tendered at least RM3.2 billion in contracts in 2019 in renewable energy (RE) and energy efficiency (EE) projects, where the tenders include projects under the RM2 billion large-scale solar (LSS 3) scheme (https://www.thestar.com.my/business/business-news/2019/03/21/government-to-tender-out-rm3-2bil-in-green-contracts-this-year/).
- Shell first to have certified ‘green retail fuels stations’ in Asia Pacific
https://www.shell.com.my/media/2019-press-releases/green-retail-fuels-stations.html
Youtube video of Shell Green retail stations in Malaysia
https://www.youtube.com/watch?time_continue=81&v=tBQk7gIx3yo
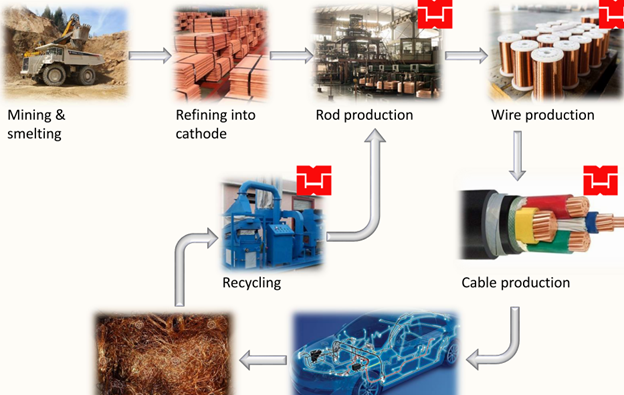
- Block diagram of Vertically integrated production flow with involvement of new machine which can use recycled copper
- Overview and Outlook of the Copper Wire Industry in Malaysia
Copper wires’ uses include, among others, power generation, electricity transmission and distribution as well as telecommunications. Some of the main E&E products that require copper wires include motors, cables, transformers, inductors, generators, consumer electronics, electromagnets as well as elevators and escalators. In Malaysia, the copper wire market grew, in terms of sales value, from RM2.7 billion in 2013 to an estimated RM3.3 billion in 2017, at a compounded annual growth rate (“CAGR”) of 5.1%. Meanwhile, the volume of copper wires consumed in Malaysia grew from 117.7 metric kilotonnes in 2013 to reach an estimated 143.5 metric kilotonnes in 2017, at a CAGR of 5.1% during the period. PROVIDENCE forecasts the copper wire market size in Malaysia to grow, in terms of sales value, at a CAGR of 5.6% between 2018 and 2020, reaching RM3.9 billion in 2020. PROVIDENCE also forecasts the consumption volume of copper wires in Malaysia to grow at a CAGR of 5.1% between 2018 and 2020 to reach 166.7 metric kilotonnes in 2020.
Malaysia’s exports of copper wires increased from RM1.6 billion in 2013 to RM2.7 billion in 2017, recording a CAGR of 14.0% during the period. China is among the top 5 export destinations of copper wire from Malaysia alongside India, Australia and Singapore. In 2017, Malaysia’s exports of copper wires to India, Australia, Singapore and China constituted 52.1%,15.3%, 8.9% and 3.7% of total copper wire exports in Malaysia. Malaysia’s exports of copper wires to countries in Southeast Asia (comprising Singapore, Brunei, Thailand, the Philippines, Cambodia and Myanmar) comprised 16.9% of total copper wire exports in Malaysia in 2017.
(Source: IMR Report)
Related Stocks
| Chart | Stock Name | Last | Change | Volume |
|---|
More articles on Davidtslim sharing
LCTITAN: Beneficiary of Strong demands of Packaging, Mask and Glove's raw materials (Davidtslim)
Created by davidtslim | Oct 03, 2020
NOVA: An Expanding Healthcare OBM player with high profit margin (Davidtslim)
Created by davidtslim | Aug 28, 2020
Samchem – Beneficiary of Raw Chemical Material supply to support healthcare industry (Davidtslim)
Created by davidtslim | Aug 06, 2020
Supermax Part 2: Timely Expansion and Increasing ASP (Davidtslim)
Created by davidtslim | Aug 04, 2020
STRAITS (0080): A winner from the structural changes to bunker biz due to IMO2020 (Davidtslim)
Created by davidtslim | May 15, 2019
Discussions
7 people like this. Showing 2 of 2 comments
No right Nor wrong Only to Win
Why tawin do the reverse way ?
No give face to author at all... kikiki
2019-09-03 18:32
Post a Comment
Featured Posts


Apps


Top Articles
1
Super stock
2
Good Articles to Share
3
Good Articles to Share
Japan and Philippines sign landmark defence pact amid tensions in South China Sea
4
Good Articles to Share
5
Good Articles to Share
Indian PM Modi heads to Russia for first visit since Ukraine war
6
Good Articles to Share
LIVE: French National Assembly after left-wing surges in parliamentary election
7
Good Articles to Share
8
Good Articles to Share
Indian PM Modi in Moscow for first bilateral state visit of his third term
#
Stock
Score
Daily Stocks
Stock Name
Last
Change
Volume
Stock Name
Last
Change
Volume
Stock Name
Last
Change
Volume
Featured Advertisers / Partners


Ride The Bull Short The Bear
CS Tan
4.9 / 5.0
This book is the result of the author's many years of experience and observation throughout his 26 years in the stockbroking industry. It was written for general public to learn to invest based on facts and not on fantasies or hearsay....
No right Nor wrong Only to Win
下一步铜价怎么走?
https://cn.investing.com/analysis/article-200435065
2019-09-01 21:16