


MQTrader Stock Discussion
MQ Trader Analysis – SAPNRG (5218) – Volatility vs Opportunity?

MQTrader Jesse
Publish date: Wed, 30 Jan 2019, 05:26 PM
SAPNRG (5218)

Sapura Energy Bhd is an integrated oil and gas services and solutions provider. Its operating segments are Engineering and Construction, Drilling, Energy and Corporate.
Sapura Energy Fundamental Analysis
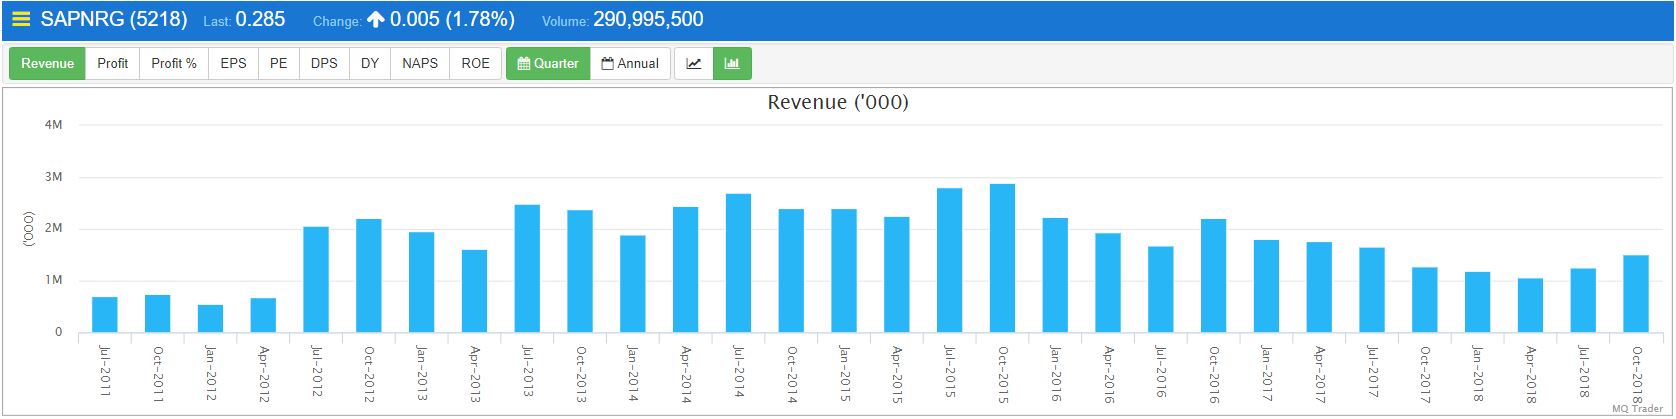
Figure 1: Quarter Revenue of SAPNRG
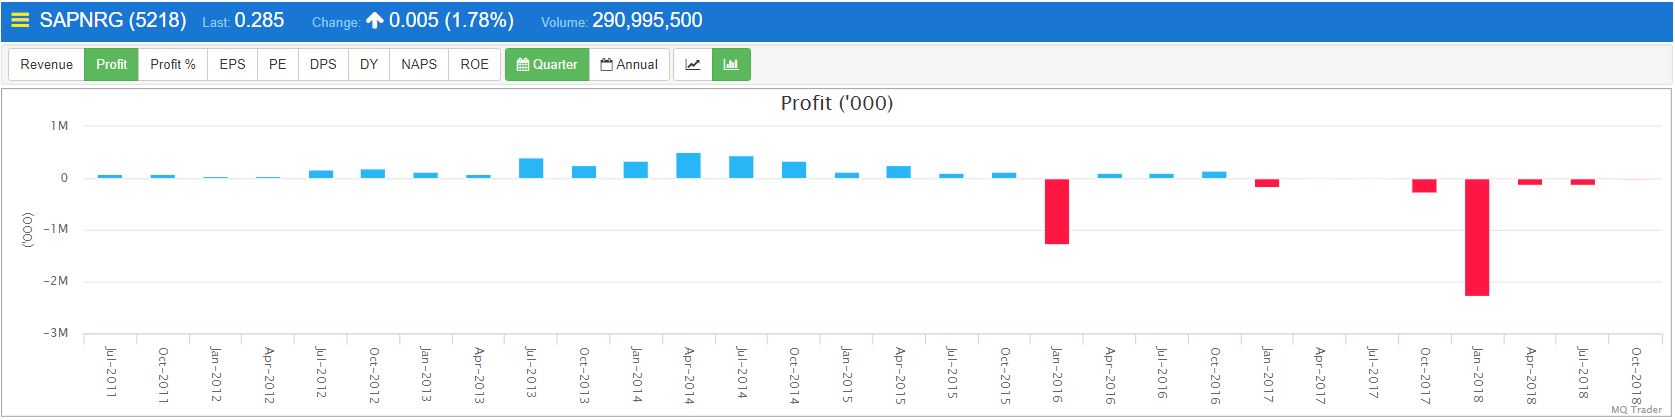
Figure 2: Quarter profit of SAPNRG
Figure 1 and Figure 2 shows that SAPNRG fails to convert sales to profit, as losses have been created continuously since 4Q17.
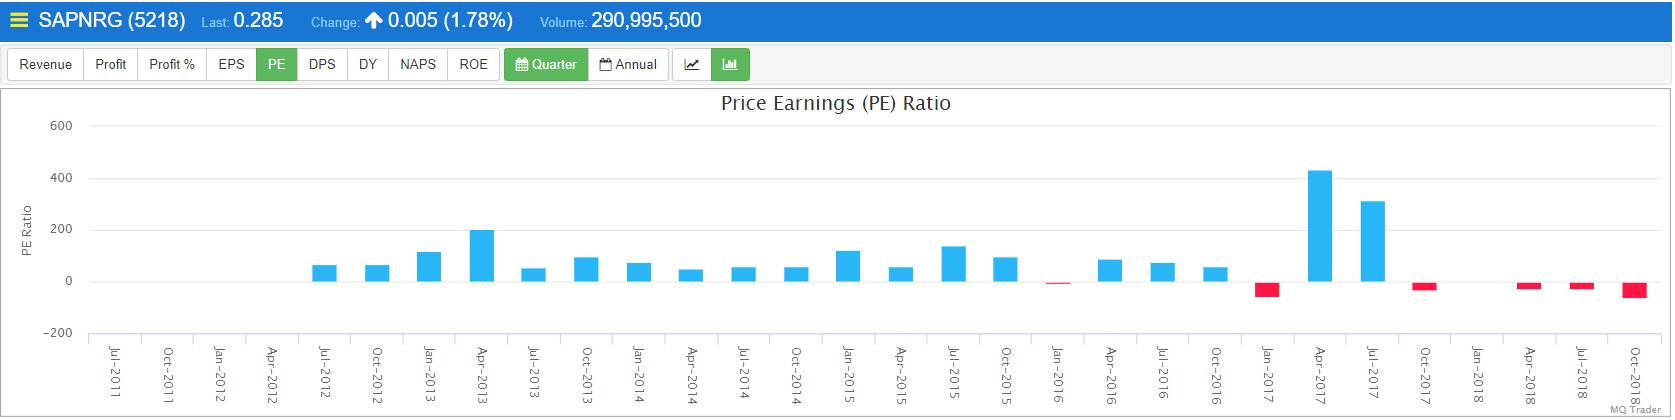
Figure 3: Quarter PE ratio of SAPNRG
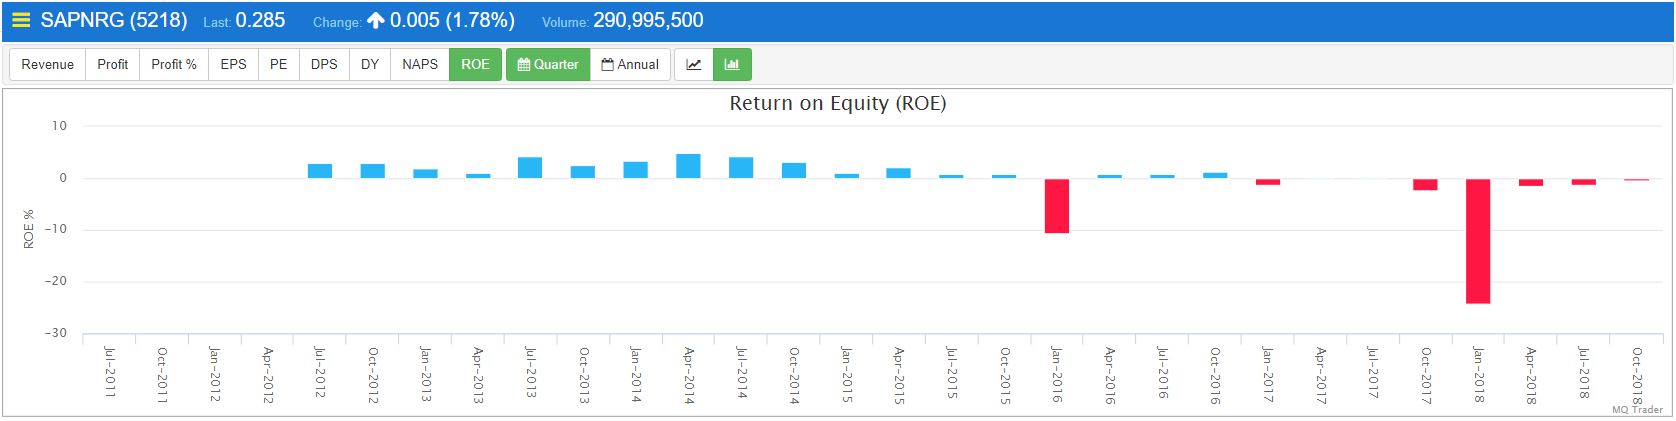
Figure 4: Quarter ROE of SAPNRG
SAPNRG’s quarter profits and PE ratio exhibit the similar trend showing that the share price of SAPNRG is at its fair value. As a result of the losses created since 4Q17, SAPNRG’s PE ratio and ROE indicate negative values.
MQ Fundamental Rating
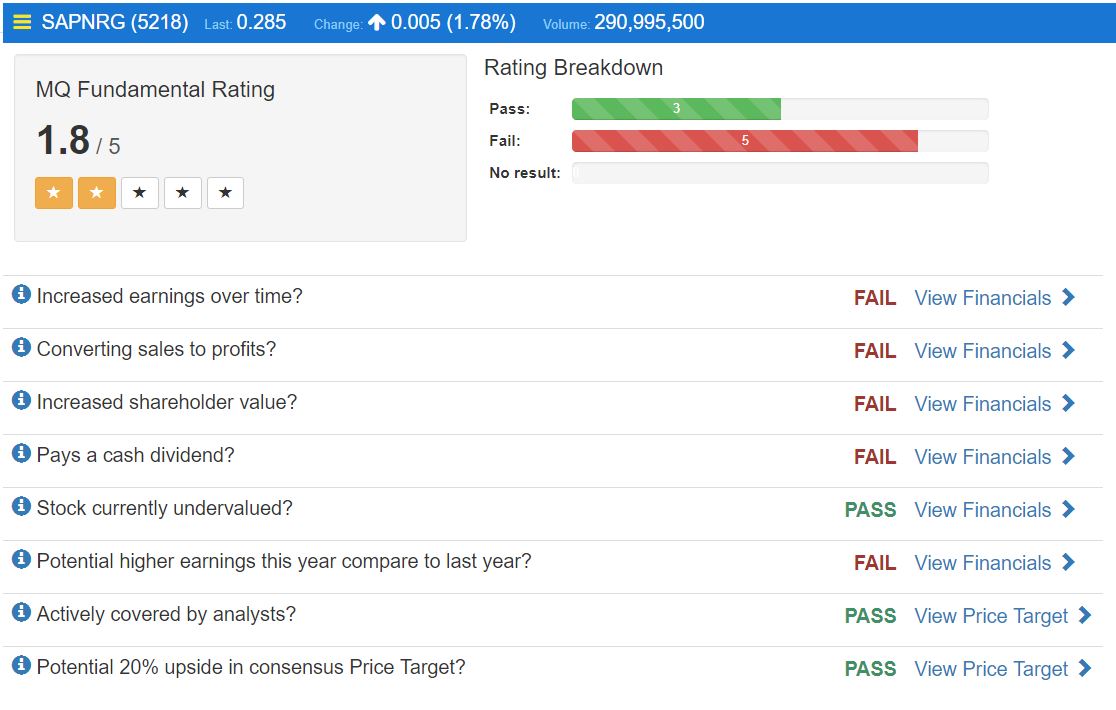
Based on the analysis above, it is a fundamentally poor stock, as it fails most of the fundamental tests. Normally, we will not pick stocks with fundamental rating which is less than 2.5 for long term investment.
Overall technical chart
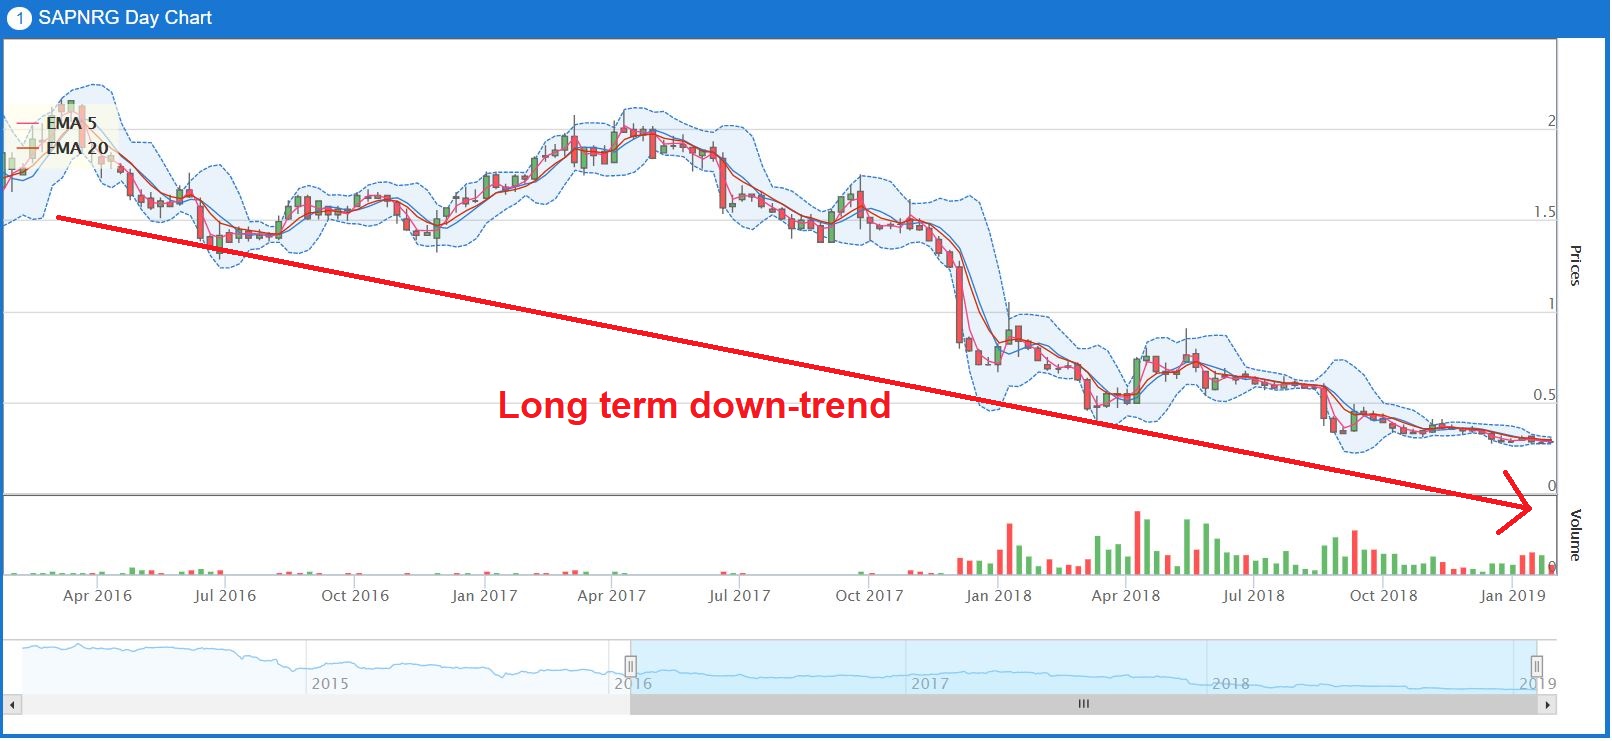
Sapura Energy has faced long term down-trend since 2016 - challenges remain strong for oil & gas sector as the brent crude oil price remain volatile.
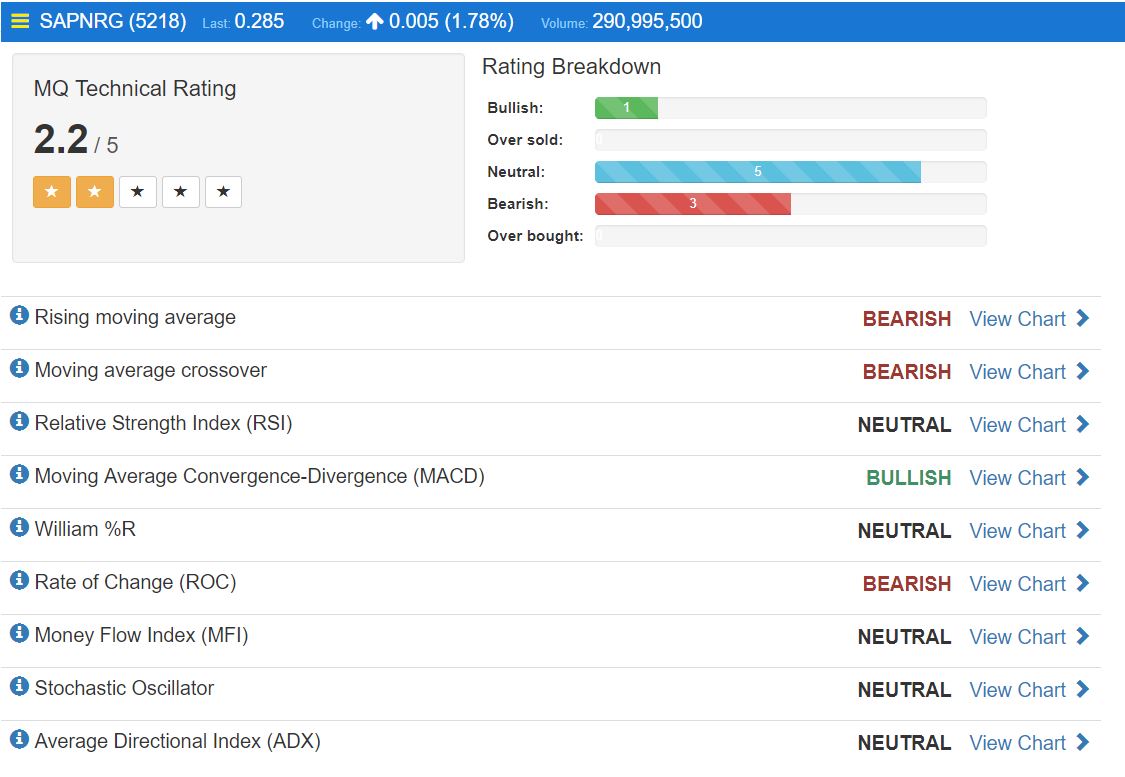
MQ Technical Rating
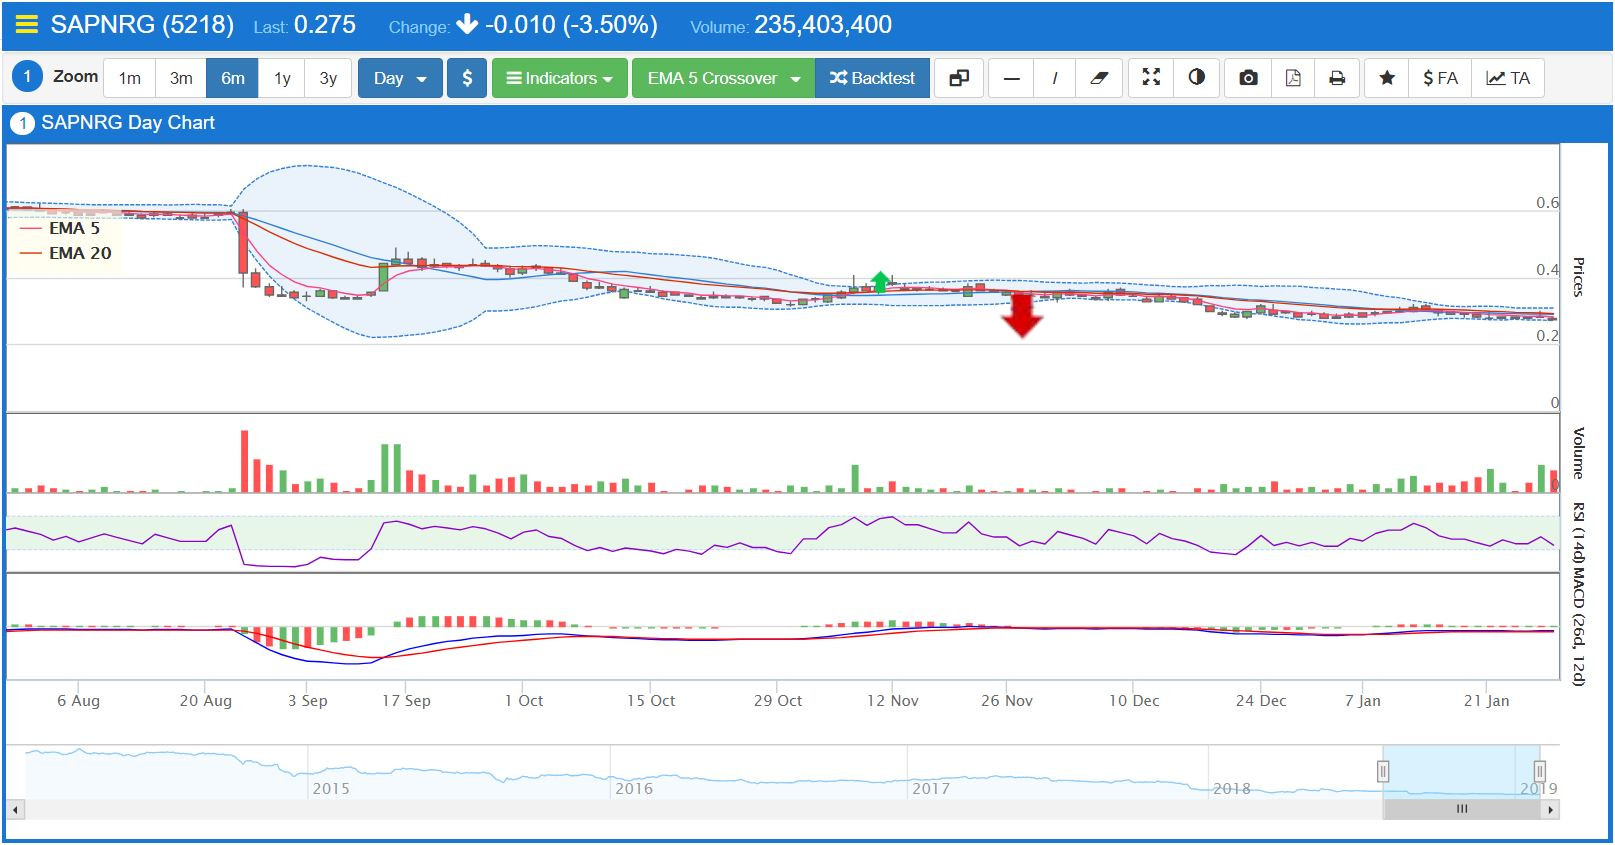
EMA 5 Crossover Daily Chart
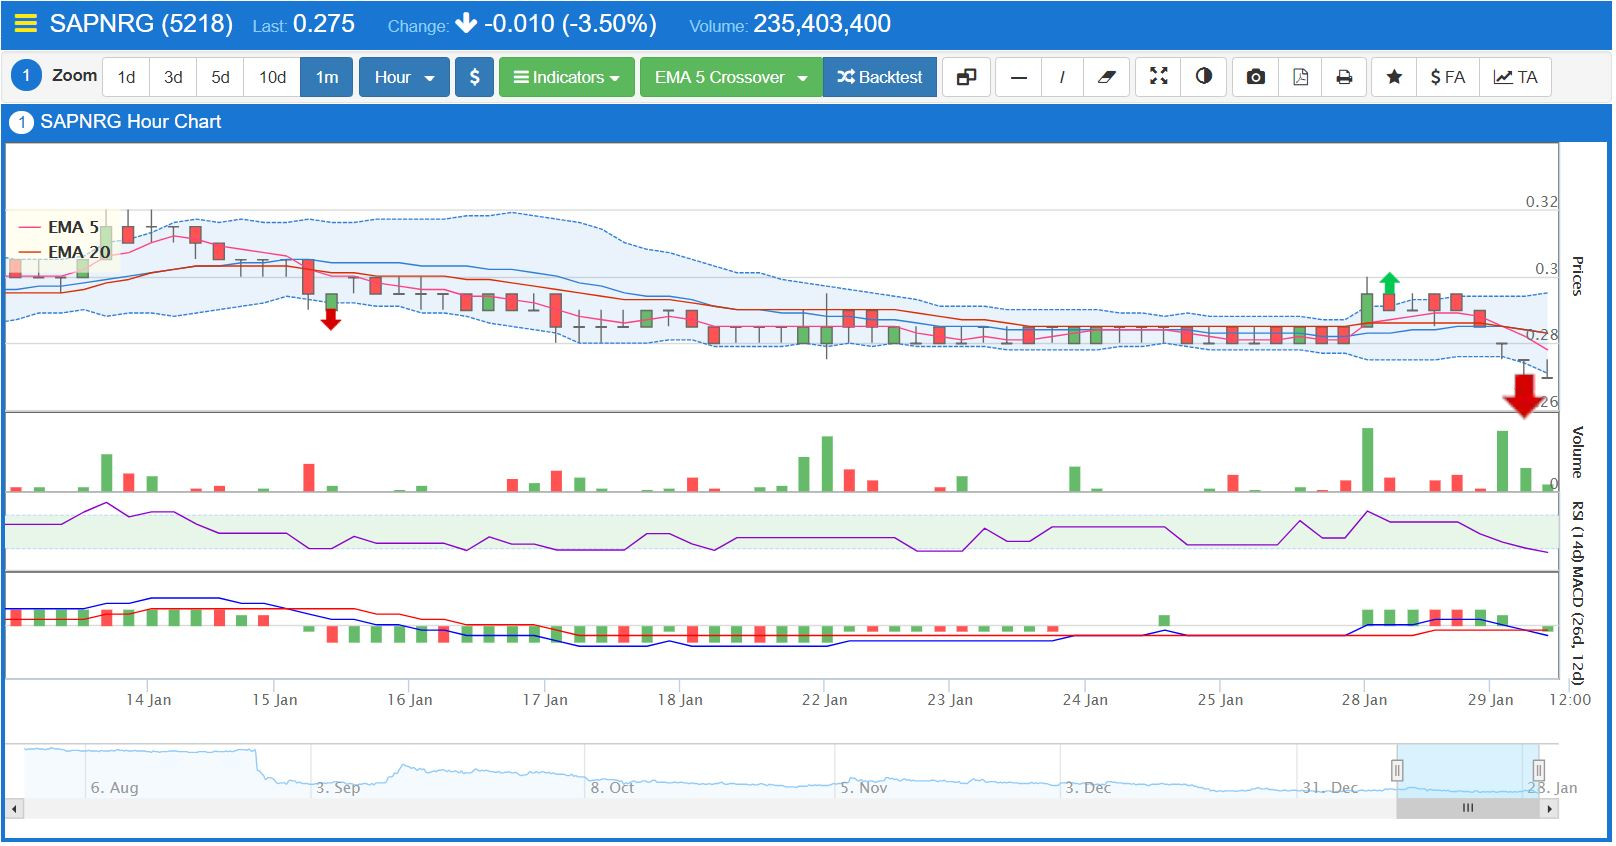
EMA 5 Crossover Hourly Chart
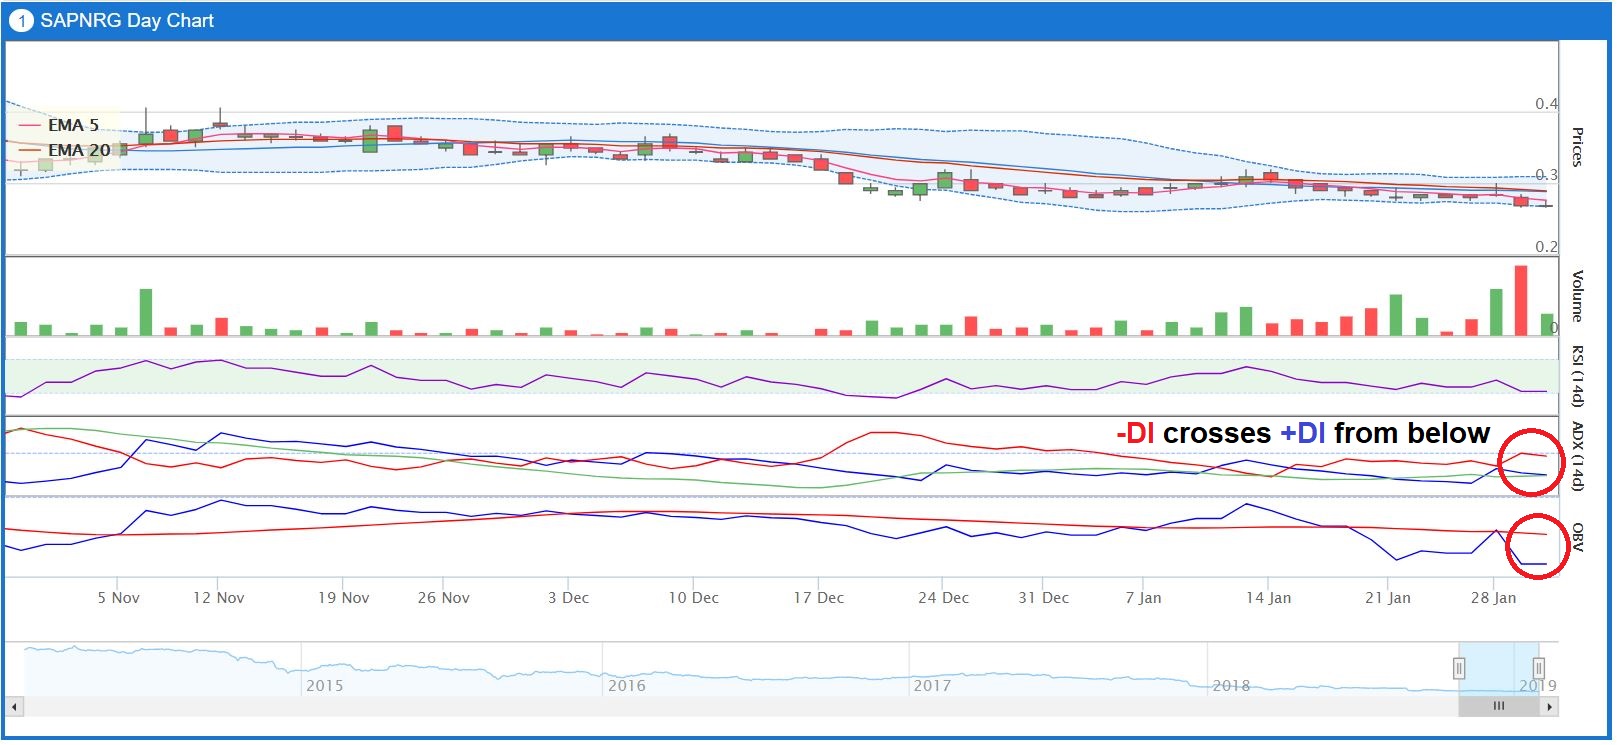
ADX and OBV of SAPNRG
SAPNRG has been experiencing a long-term bearish trend for a year and it is still undergoing down-trending price movement, as MQ technical rating is indicating 2.2/5.0 at the moment. Based on MQ Trader criteria, a stock with bullish trend should achieve MQ technical rating that is higher than 3.0/5.0.
Sell signals are detected by most of the MQ Trader trading strategies confirming the selling momentum on SAPNRG’s shares as shown in EMA 5 Crossover charts above. Furthermore, technical indicators such as ADX and OBV are showing negative results due to greater selling pressure over buying pressure.
MQ Trader View
One of the main reason that causes SAPNRG’s recent down-trending share price movement is the under-subscription of its right shares. The under-subscription rate of 18.5% results in the 1.8bil ordinary shares to be held by the underwriters Maybank Investment Bank, CIMB Investment Bank and RHB Investment Bank. Provided Sapura’s average daily trading volume is 116mil over the past 1 year, the underwriters will require a few months to dispose these shares. Thus, it is expected that the selling pressure will be greater than buying pressure during this period.
Conclusion
According to the analysis above, we will save our capital for better opportunities instead of holding or buying the share that are in downtrend, especially for those without good fundamentals. At the meantime, we will monitor the momentum of fundamentally strong counters (Fundamental rating > 2.5) with mid-term bullish up-trending chart patterns.
MQ Trader Analysis Tool
To view SAPNRG’s fundamental analysis on MQ Trader: https://klse.i3investor.com/mqtrader/sf/analysis/fa/5218
To view SAPNRG’s technical analysis on MQ Trader: https://klse.i3investor.com/mqtrader/sf/analysis/stkta/5218
To know more about MQ Trader system, please visit MQ Trader Education Series.
Community Feedback
We encourage traders to try out and evaluate the MQ Trader system and provide us feedback on the features you like to see in the system. We have received many positive feedbacks so far, and we are currently compiling and reviewing them for possible inclusion into the next release of the system.
We would like to develop this system based on community feedback to cater for community needs. Thanks to all those who have provided valuable feedback to us. Keep those feedbacks coming in!
Disclaimer
This article does not represent a BUY or SELL recommendation on the stock covered. Traders and Investors are encouraged to do their own analysis on stocks instead of blindly following any Trading calls raised by various parties in the Internet. We may or may not hold position in the stock covered, or initiate new position in the stock within the next 7 days.
Join us now!
MQ Trader stock analysis system uses Artificial Intelligence (AI), various technical indicators and quantitative data to generate accurate trading signals without the interference of human's emotions and bias against any particular stock. It comprises trading strategies which are very popular among fund managers for analysing stocks.
MQ Trader stock analysis system is SPONSORED for MQ Trader members. To use this amazing tool, you can sign up via MQ Trader Sign Up!
Contact us
Please do not hesitate to contact us if you have any enquiry:
Email: admin@mqtrader.com
Related Stocks
| Chart | Stock Name | Last | Change | Volume |
|---|
More articles on MQTrader Stock Discussion
MQ Trader Analysis - GAMUDA (5398) - Road to recovery from Pandemic
Created by MQTrader Jesse | May 20, 2021
MQ Trader Analysis - TEO SENG (7252) - The company that lays golden eggs?
Created by MQTrader Jesse | Jul 05, 2019
MQ Trader Analysis - INTA (0192) - Safe sail through the stormy weather in construction
Created by MQTrader Jesse | Jun 03, 2019
Featured Posts
Introducing MY's First IPO Fund for Sophisticated Investors!
New Update. Discover investment communities that resonate with your ideas
M & A Value Partners IPO Equity Fund has been launched - Targeted 13% Return p.a
Latest Videos


Apps


Top Articles
1
BFM Podcast
2
3
4
5
Mercury Securities Research
6
BFM Podcast
7
BFM Podcast
8
BFM Podcast
#
Stock
Score
Daily Stocks
Stock Name
Last
Change
Volume
Stock Name
Last
Change
Volume
Stock Name
Last
Change
Volume
Featured Advertisers / Partners


Ride The Bull Short The Bear
CS Tan
4.9 / 5.0
This book is the result of the author's many years of experience and observation throughout his 26 years in the stockbroking industry. It was written for general public to learn to invest based on facts and not on fantasies or hearsay....
VenFx
Preparing for 0.235
I wantvto enter my 2nd bacth.
2019-01-30 23:14