


MQTrader Stock Discussion
MQ Trader Analysis – CARIMIN (5257) – Short Term Rising Star?

MQTrader Jesse
Publish date: Tue, 12 Feb 2019, 04:55 PM
CARIMIN (5257)

Carimin Petroleum Bhd provides technical and engineering support service to oil and gas industry. The company’s service include hook up, commissioning production platform system maintenance and upgrading, manpower supply and minor fabrication service.
MQ Fundamental Analysis
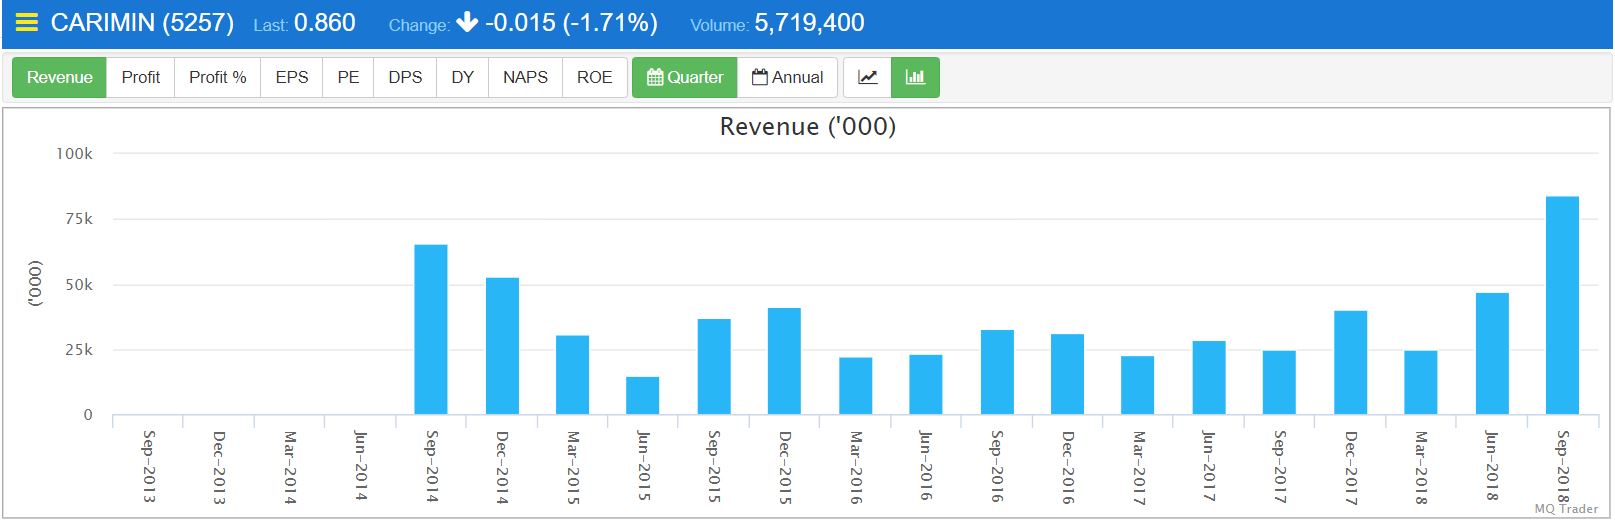
Figure 1: Quarter revenue of CARIMIN
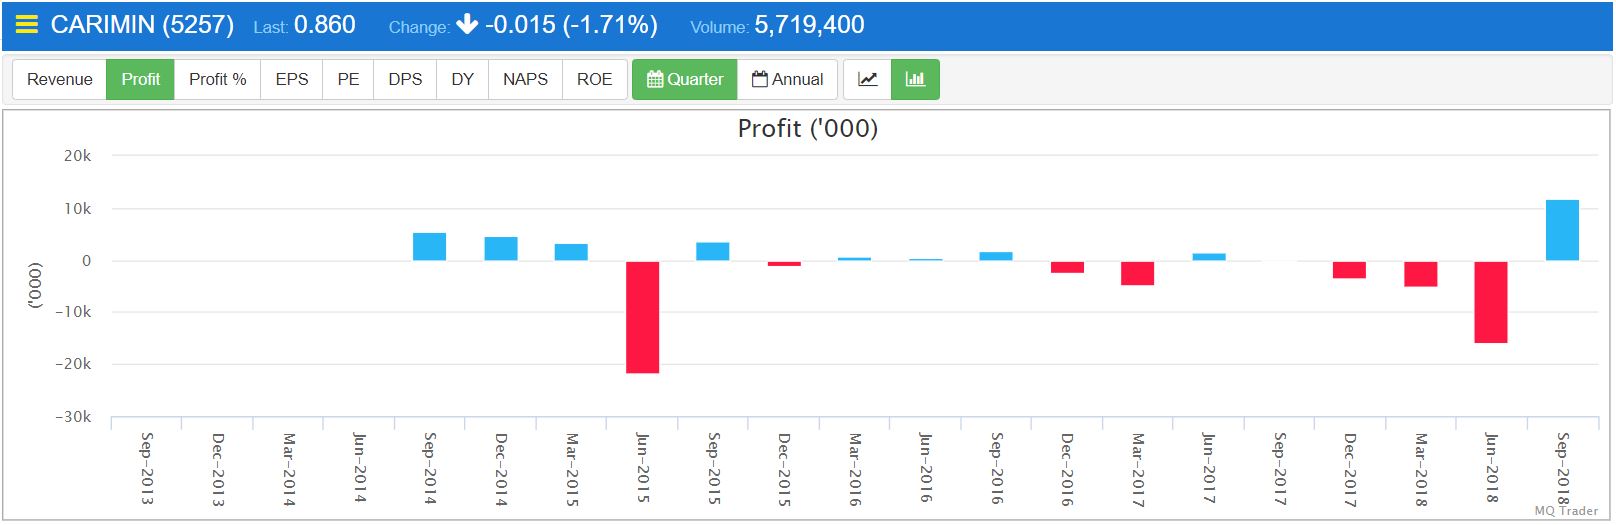
Figure 2: Quarter profit of CARIMIN
Figure 1 and 2 shows that the revenue and profit earned by CARIMIN are not growing proportionally to each other. This is the main factor that deteriorates CARIMIN’s fundamental rating, as the ability of a company to convert sales to profit is very crucial in determining the sustainability and prospectus of a company.
MQ Fundamental Rating
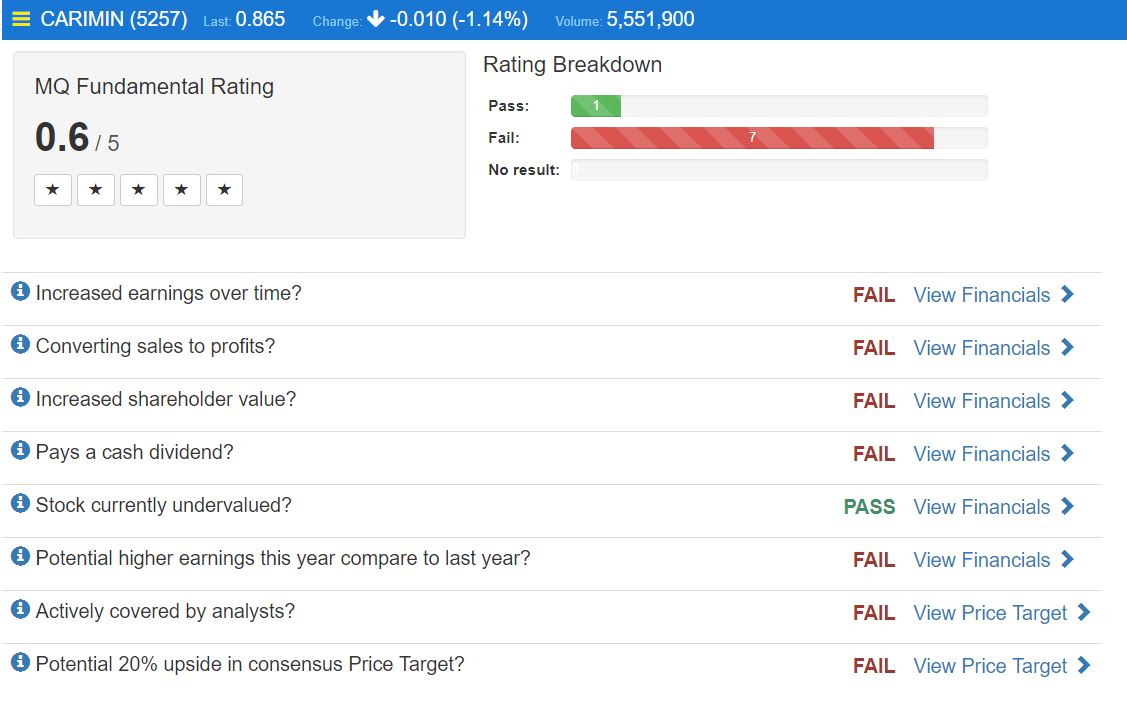
Source: MQ Trader stock analysis system
It is fundamentally poor stock, as it fails most of the fundamental tests. According to MQ Trader criteria, stocks with fundamental rating which is less than 2.5/5.0 are not suitable for long term investment.
Overall trend of CARIMIN
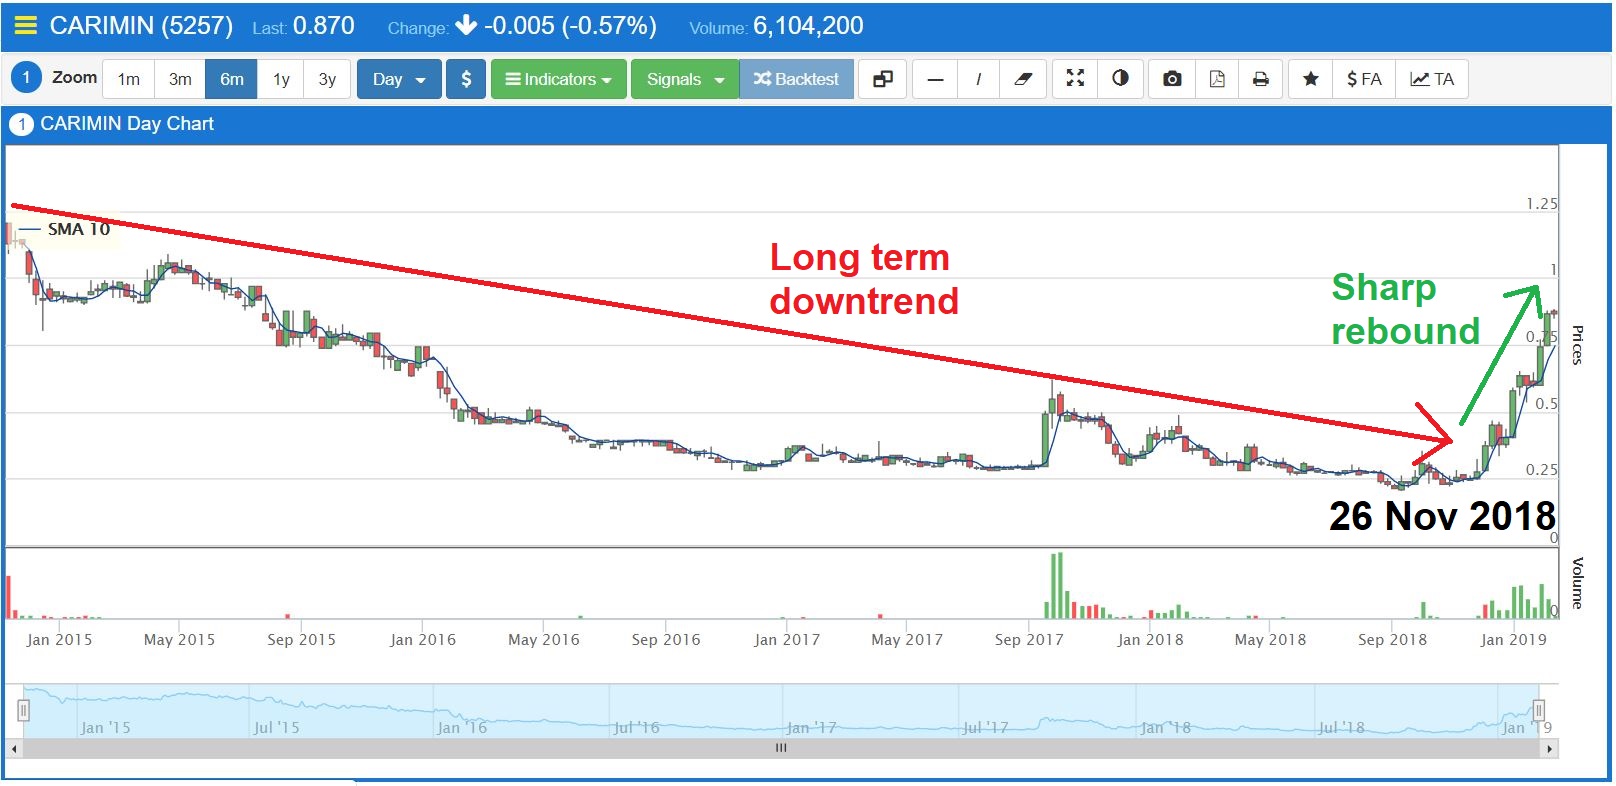
Source: MQ Trader stock analysis system
CARIMIN’s share price has been experiencing a long term downtrend for more than 3 years due to poor financial result with huge losses as shown in Figure 2. A sharp rebound was observed since 26 Nov 2018 when its share price was boosted as a result of its good 3Q18 financial result. According to Figure 1 and 2, it was observed that the greatest revenue and net profit was earned in 3Q18 as compared to its historical financial result which marks a new breakthrough achieved by CARIMIN.
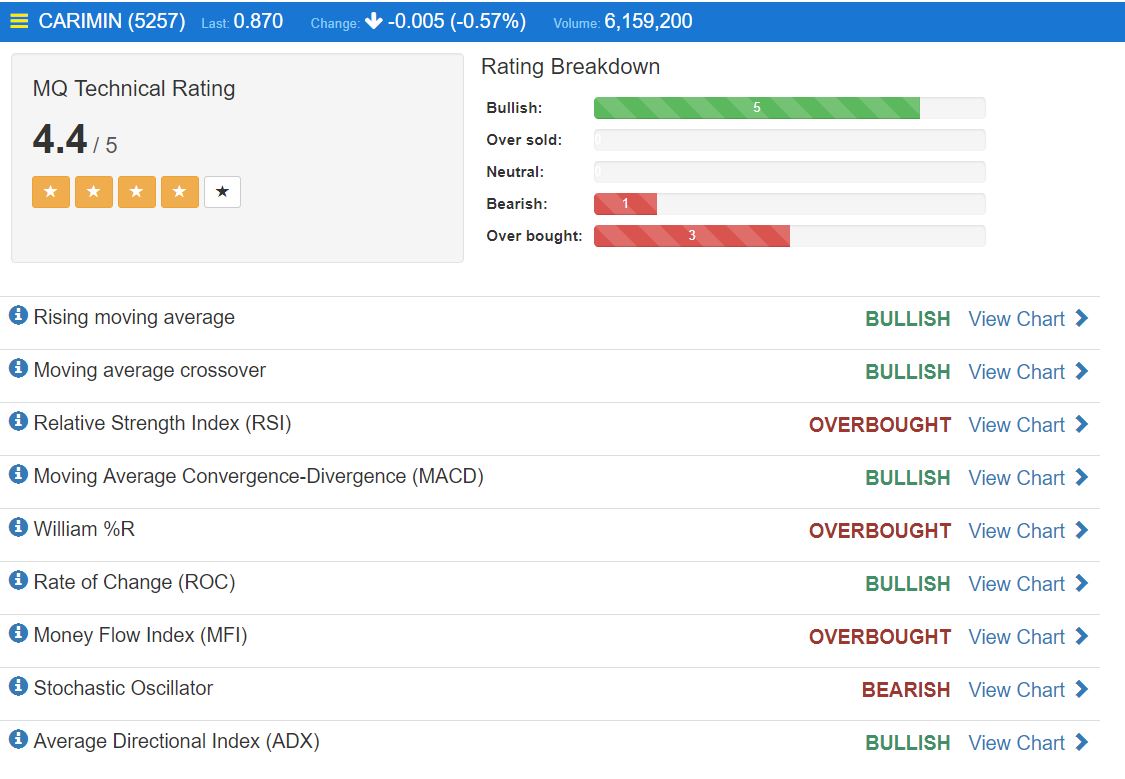
MQ Technical Rating
Daily ADX Crossover Chart
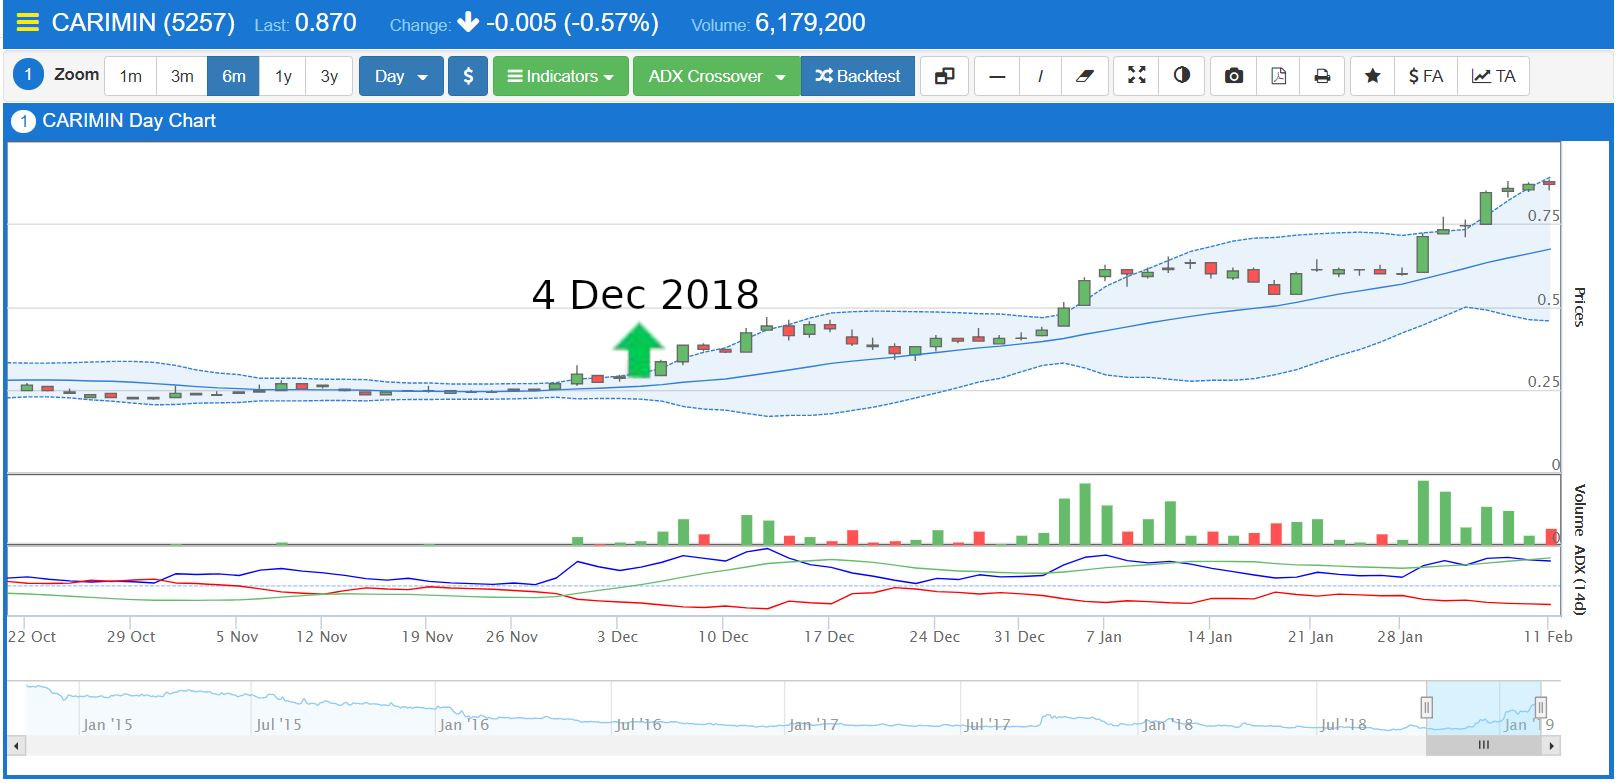
Source: MQ Trader stock analysis system
Hourly EMA 5 Crossover Chart
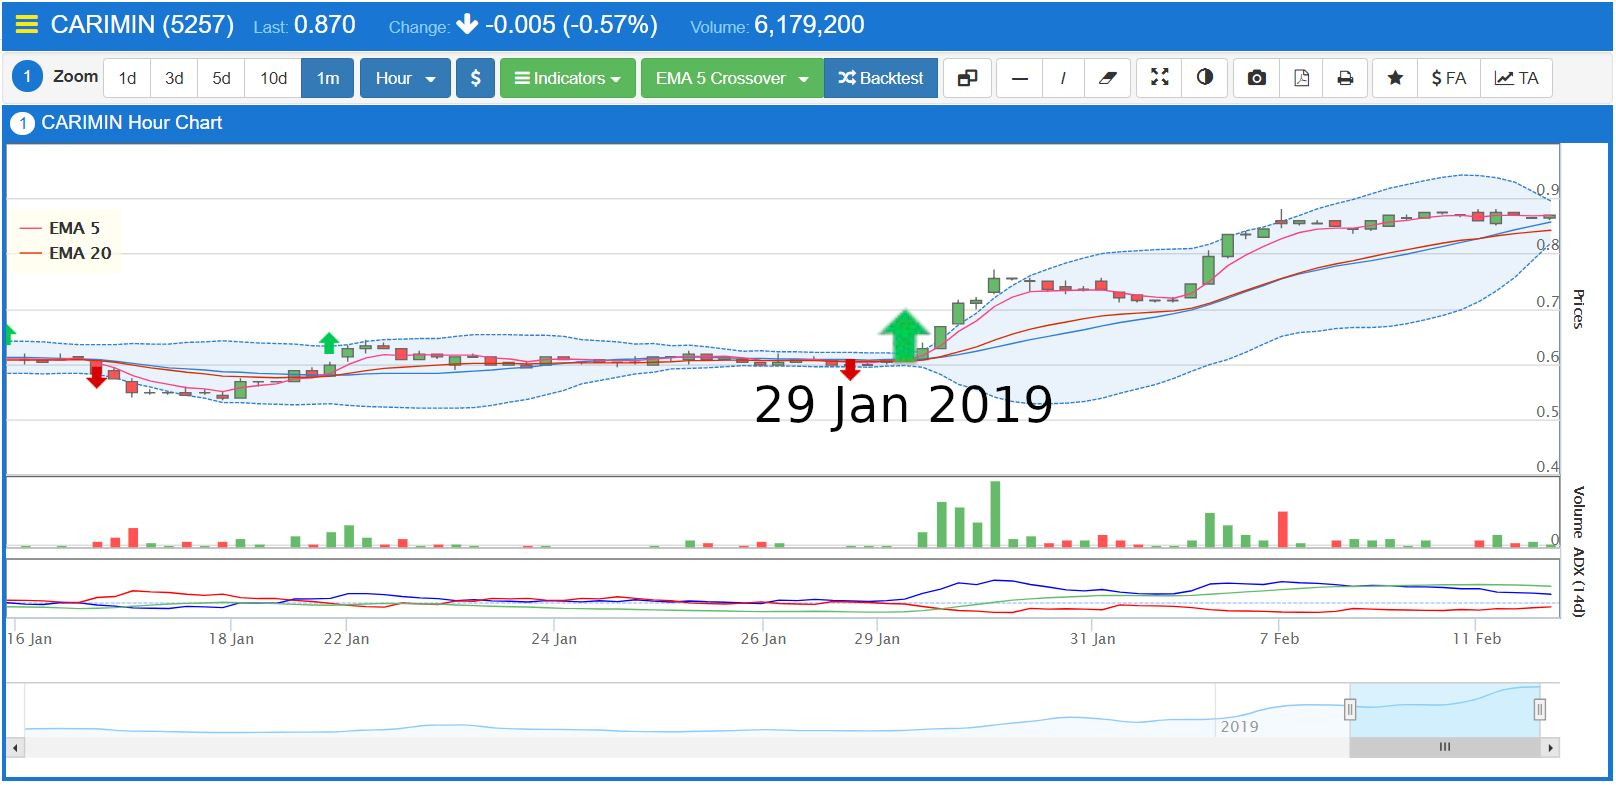
Source: MQ Trader stock analysis system
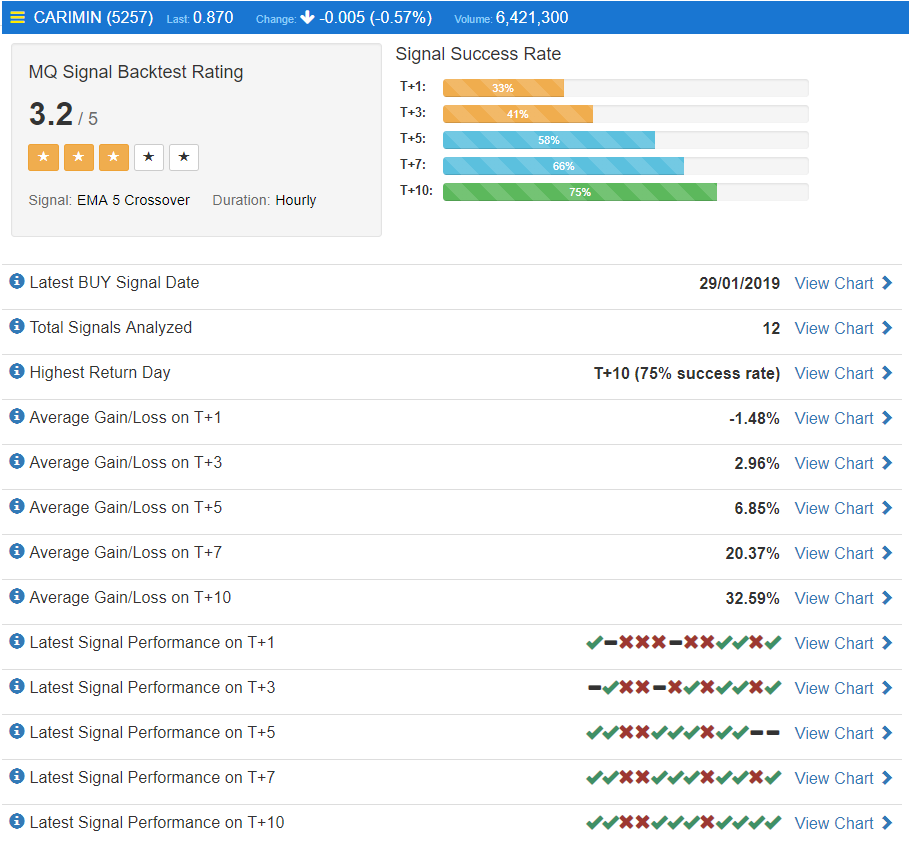
MQ Backtesting
Source: MQ Trader stock analysis system MQ Robo Advisor CommentaryBackgroundMQ Signal Backtest service performed Live Backtesting on stock CARIMIN (5257) based on EMA 5 Crossover Trade Signal and Hourly chart duration. Up to 5 years historical data were used for this Live backtesting service. Test ResultA total of 12 Trade Signals were analyzed. The latest Trade Signal was detected on 29/01/2019. On average, the Backtest result shows that the best performance is achieved on T+10 (14/02/2018) after trading day with 75% success rate. Overall, this Trade Signal achieved a MQ Signal Backtest Rating of 3.1/5 stars. This represents a Positive rating (MQ Backtesting rating > 3.0/5.0) proving that the winning chance of the signal are considerably high. Traders may further analyze this Stock/Signal for trade opportunity. |
MQ Trader’s ViewCARIMIN’s management has steered this company to the right direction successfully, as it swung to the black in 3Q18 with a net profit of RM 11.72 million from a net loss of RM 277,000 in the previous quarter due to its increased revenue from its oil and gas division. The improvement on its balance sheet is reflected immediately by the sharp rebound of its share price. However, this catalyst does not guarantee the persistent uptrend of its share price, as it will be influenced by several risks:
|
Conclusion
In our opinion, we will consider buy and hold for mid term and start grabbing opportunities by using trading strategies (i.e. EMA 5 Crossover). News or announcement should be monitored from time to time, as this counter is currently only suitable for mid term investment due to its poor fundamentals. At the same time, we have to be aware of the existence of sell signals detected by MQ Trader Trading Strategies when any unfavorable event happens to CARIMIN, so that we can exit our position to protect our capital during that time.
MQ Trader Analysis Tool
To view CARIMIN’s fundamental analysis on MQ Trader: https://klse.i3investor.com/mqtrader/sf/analysis/fa/5257
To view CARIMIN’s technical analysis on MQ Trader: https://klse.i3investor.com/mqtrader/sf/analysis/stkta/5257
To know more about MQ Trader system, please visit MQ Trader Education Series.
Community Feedback
We encourage traders to try out and evaluate the MQ Trader system and provide us feedback on the features you like to see in the system. We have received many positive feedbacks so far, and we are currently compiling and reviewing them for possible inclusion into the next release of the system.
We would like to develop this system based on community feedback to cater for community needs. Thanks to all those who have provided valuable feedback to us. Keep those feedbacks coming in!
Disclaimer
This article does not represent a BUY or SELL recommendation on the stock covered. Traders and Investors are encouraged to do their own analysis on stocks instead of blindly following any Trading calls raised by various parties in the Internet. We may or may not hold position in the stock covered, or initiate new position in the stock within the next 7 days.
Join us now!
MQ Trader stock analysis system uses Artificial Intelligence (AI), various technical indicators and quantitative data to generate accurate trading signals without the interference of human's emotions and bias against any particular stock. It comprises trading strategies which are very popular among fund managers for analysing stocks.
MQ Trader stock analysis system is SPONSORED for MQ Trader members. To use this amazing tool, you can sign up via MQ Trader Sign Up!
Contact us
Please do not hesitate to contact us if you have any enquiry:
Email: admin@mqtrader.com
Related Stocks
| Chart | Stock Name | Last | Change | Volume |
|---|
More articles on MQTrader Stock Discussion
MQ Trader Analysis - GAMUDA (5398) - Road to recovery from Pandemic
Created by MQTrader Jesse | May 20, 2021
MQ Trader Analysis - TEO SENG (7252) - The company that lays golden eggs?
Created by MQTrader Jesse | Jul 05, 2019
MQ Trader Analysis - INTA (0192) - Safe sail through the stormy weather in construction
Created by MQTrader Jesse | Jun 03, 2019
Featured Posts


Latest Videos


MQ Trading Signals
Time
Signal
Duration
Type
2024-07-18 16:30:00
EMA 5
10 Mins
BUY
2024-07-18 16:05:00
TURTLE SYSTEM 20
5 Mins
SELL
2024-07-18 16:00:00
EMA 5
5 Mins
BUY
2024-07-18 16:00:00
TURTLE SYSTEM 20
5 Mins
BUY
2024-07-18 11:40:00
EMA 5
10 Mins
SELL
Apps


Top Articles
1
CEO Morning Brief
PGF Capital to Distribute Thermal Insulated Panels for Data Centres
2
Good Articles to Share
3
4
Rakuten Trade Research Reports
6
Bimb Research Highlights
7
RHB Investment Research Reports
8
南洋行家论股
#
Stock
Score
Daily Stocks
Stock Name
Last
Change
Volume
Stock Name
Last
Change
Volume
Stock Name
Last
Change
Volume
Featured Advertisers / Partners


Ride The Bull Short The Bear
CS Tan
4.9 / 5.0
This book is the result of the author's many years of experience and observation throughout his 26 years in the stockbroking industry. It was written for general public to learn to invest based on facts and not on fantasies or hearsay....
dusti
On an up trend
2019-02-14 16:55