FKLI - Bulls Are Still Strong
rhboskres
Publish date: Mon, 24 Jun 2019, 11:25 AM

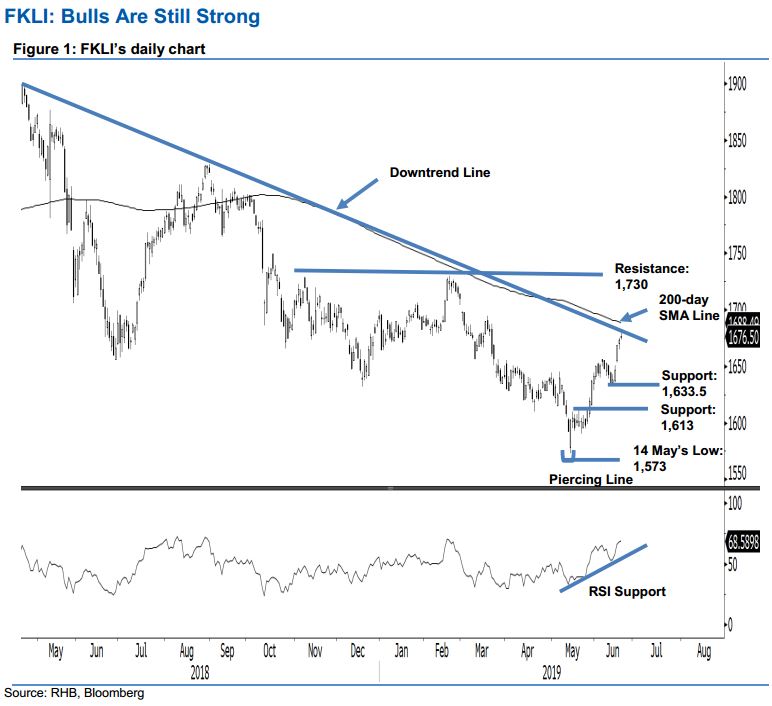
Still doing well; maintain long positions. Last Friday, the FKLI formed a white candle and, in the process, tested the downtrend line (as drawn in the chart) that stretched from Apr 2018’s high. The session’s low and high were 1,673 pts and 1,681 pts, before the index closed at 1,676.5 pts – indicating a gain of 3 pts. It is currently trading in the resistance zone of between the said downtrend line and the 1,700-pt level (slightly above the 200-day SMA line). In the absence of price rejection signals from the said resistance zone, the counter-trend rebound that started from 14 May’s “Piercing Line” is still considered as valid and may extend further. Due to this, we maintain our positive trading bias.
As the latest price actions are still showing a positive bias, we continue to recommend traders to stay in long positions – initiated at 1,619.5 pts. A stop-loss can now be placed below 1,651 pts, the high of 18 Jun.
Towards the downside, immediate support is still at 1,633.5 pts, which was the low of 17 Jun. This is followed by 1,613 pts, the high of 13 May. Moving up, the immediate resistance is pegged at 1,700 pts, being the next round figure. This is followed by 1,730, near the high of 21 Feb.
Source: RHB Securities Research - 24 Jun 2019
More articles on RHB Retail Research
Created by rhboskres | Aug 26, 2024


