Hang Seng Index Futures - Stick to Long Positions
rhboskres
Publish date: Fri, 05 Jul 2019, 04:48 PM

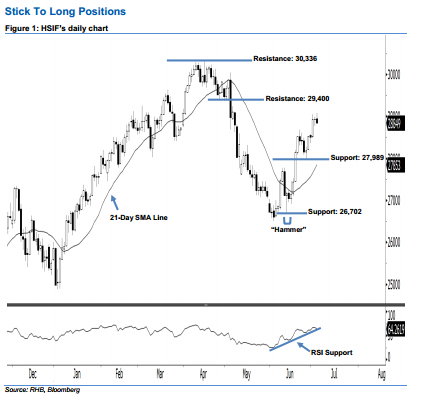
Stay long, with a trailing-stop set below the 27,989-pt support. The HSIF ended lower to form a black candle yesterday. It dropped to a low of 28,834 pts during the intraday session, before ending at 28,849 pts for the day. However, it is not surprising that the market is experiencing profit-taking activities after the recent gains. On a technical basis, the bullish sentiment stays intact. This is because the index is still holding above the rising 21-day SMA line. Overall, we believe the rebound that started from 13 Jun’s “Hammer” pattern may continue.
Based on the daily chart, the immediate support is seen at 27,989 pts, ie the low of 26 Jun. If a breakdown arises, look to 26,702 pts – the low of 13 Jun’s “Hammer” pattern – as the next support. To the upside, the immediate resistance is maintained at 29,400 pts, which is situated near the midpoint of 6 May’s long black candle. The next resistance will likely be at 30,336 pts, or the previous high of 15 Apr.
As a result, we advise traders to maintain long positions, following our recommendation of initiating long above the 27,436-pt level on 12 Jun. In the meantime, a trailing-stop can be set below the 27,989-pt mark to lock in part of the profits.
Source: RHB Securities Research - 5 Jul 2019
More articles on RHB Retail Research
Created by rhboskres | Aug 26, 2024


