Hang Seng Index Futures - Above 21-day SMA Line
rhboskres
Publish date: Tue, 09 Jul 2019, 09:39 AM

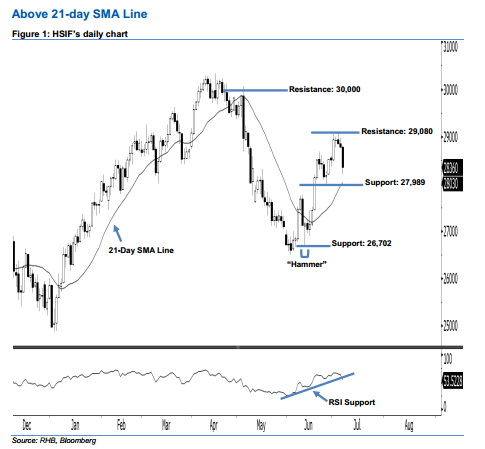
Stay long, with a trailing-stop set below the 27,989-pt support. The HSIF ended lower to form a black candle yesterday. It lost 420 pts to close at 28,360 pts, off the session’s high of 28,800 pts. Based on the current outlook, the index has been able to remain above the previously-indicated 27,989-pt support for nearly two weeks, which implies that buyers are still in control of the market. With the 21-day SMA line edging upwards, we believe the upside swing that began from 13 Jun’s “Hammer” pattern may continue. Overall, we remain bullish on the HSIF’s outlook.
Based on the daily chart, the immediate support is seen at 27,989 pts, ie the low of 26 Jun. If this level is taken out, look to 26,702 pts – which was the low of 13 Jun’s “Hammer” pattern – as the next support. On the other hand, we are eyeing the immediate resistance at 29,080 pts, situated at 4 Jul’s high. The next resistance is seen at the 30,000-pt psychological spot, ie near the high of 6 May’s long black candle as well.
Thus, we advise traders to stay long, following our recommendation to initiate long above the 27,436-pt level on 12 Jun. A trailing-stop can be set below the 27,989-pt level in order to lock in part of the profits.
Source: RHB Securities Research - 9 Jul 2019
More articles on RHB Retail Research
Created by rhboskres | Aug 26, 2024


