


Round & Surge Operator Analysis
(Free) Complete Elliott Wave Trading Strategy for New Trader & Investor [ Entry - Exit ]

roundnsurge
Publish date: Mon, 20 Dec 2021, 02:24 PM
roundnsurge
0 59
"True trader react to the market" is the core of our Operator analysis. Operator Analysis analyze the price and volume of the big boys in equity market, where we currently using our analysis in gold market, Bitcoin and Malaysia market.
We will be sharing education material here such as to become a successful trader & investor, corporate action explanation, the financial instrument in the market you can utilize for your investment and more. We are here to help you understand the stock market.
We will be sharing education material here such as to become a successful trader & investor, corporate action explanation, the financial instrument in the market you can utilize for your investment and more. We are here to help you understand the stock market.
Origin of Elliott Wave 1930:
The idea behind the Elliott Wave is to assume that participants in the stock market will not learn from historical mistakes and are always blinded by greed (Motive Waves). Eventually when they realize that the market is not in line with reality, panic will surface. This is when the Corrective Waves (ABC) are formed.
Many traders and analysts use Elliott Wave extensively to predict future price movements. However, the Elliott Wave Principle was not developed as a forecasting tool, but rather to inform users of Elliott Wave's current market behavior. This has the same purpose as many theories or indicators that the general public is learning now. But most of us use these indicators or theories as a form of price prediction.
If you prefer to learn this content in video format, please go to the following link:
The formation of the Elliott wave concept:
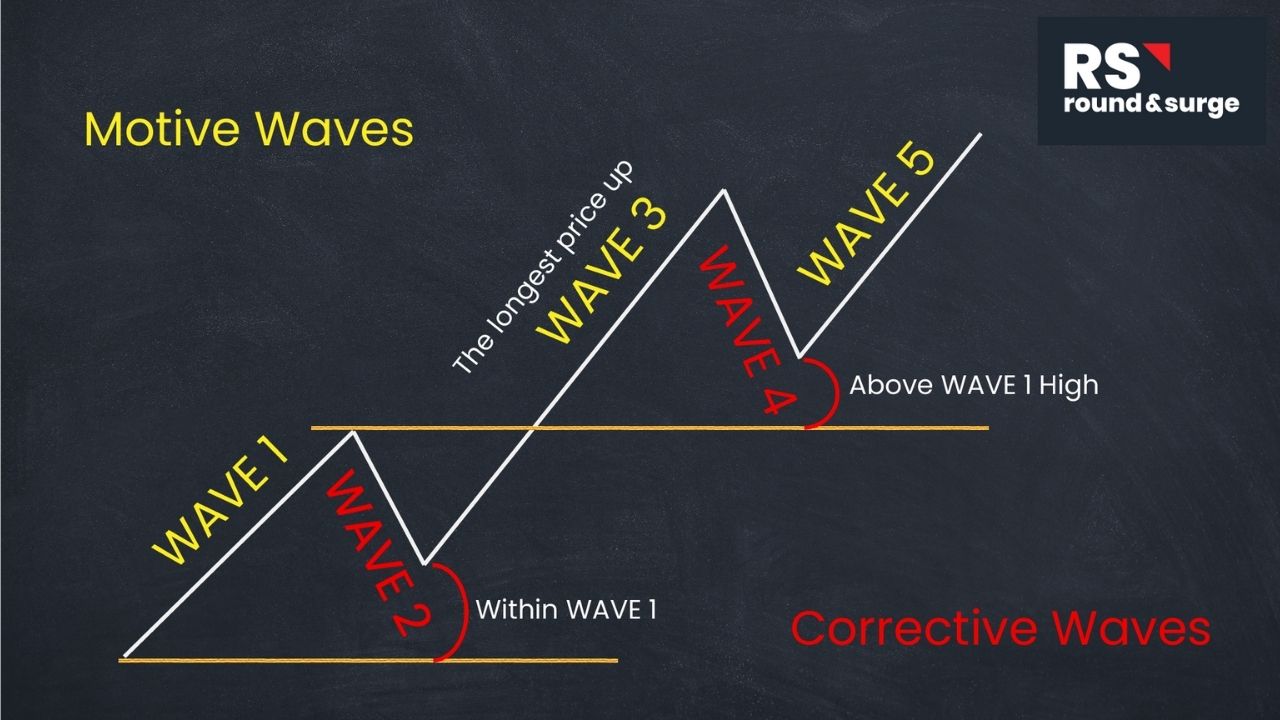
The basic Elliott wave concept is based on the "5 wave pattern".
- Use 1-3-5 waves as the motive waves for directional/same direction movement;
- Waves 2-4 are contrarian/adjusting waves of waves 1-3-5, as shown in the figure below:
Basic Characteristic of 5 Wave Pattern:
- WAVE 2 will never be lower than the starting point of WAVE 1,
- WAVE 3 is always the longest stretch than other waves,
- WAVE 4 will trade above the highest point of WAVE 1.
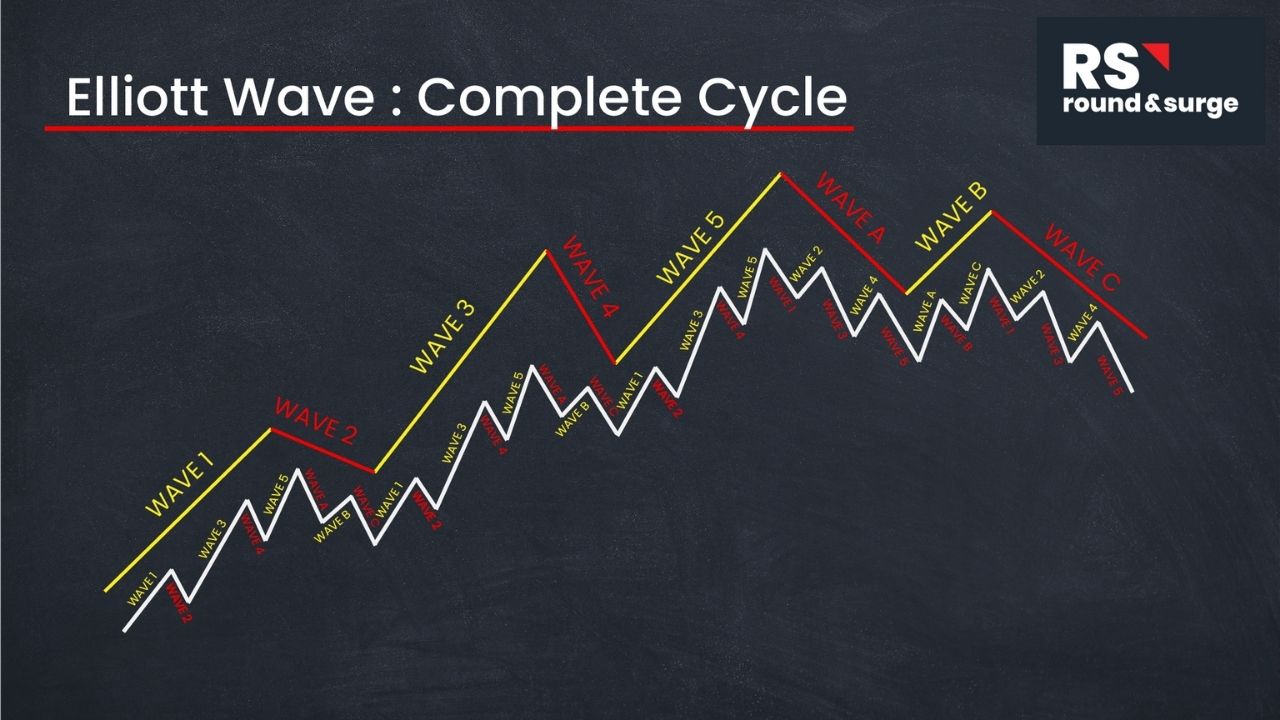
*Note: Ralph N. Elliott mentioned that the 5 WAVE mode may contain more than 5 waves. Since the 5th wave shows us the overall market trend, another 5 waves may be formed in the 5th wave. The time range can be as small as the minute chart.
Complete wave:
We mentioned earlier that the Elliott Wave Principle is based on the market's realization of reality (macro or micro fundamentals), and market value cannot justify its rationality.
A complete Elliott wave can help us understand the current market conditions, whether the market is still greedy (uptrend) or they finally realize that the balloon value of reality and underlying assets is unreasonable, and fear is created (trend reversal) ).
A complete wave consists of 8 waves:
- 5-wave motivation model (1,2,3,4,5)
- 3-wave correction pattern (A, B, C)
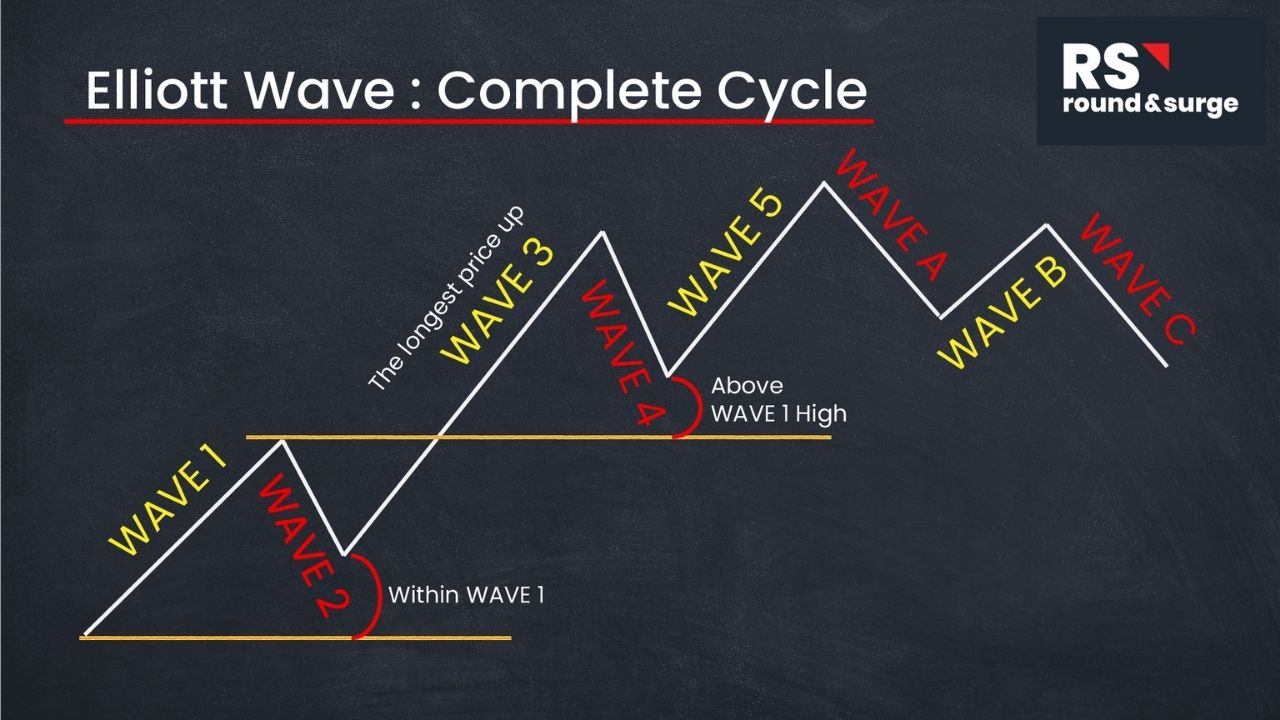
Once a complete cycle is formed, the price may enter a new complete cycle, with a total of 8 waves. Please note that the following chart is an example for a better understanding of the complete cycle of Elliott Waves. A complete cycle may be larger than several smaller complete cycles, or it may be a smaller cycle of a larger complete cycle. Investors and traders should pay attention to this when viewing, maybe you can use the weekly/monthly chart to draw a complete Elliott wave chart, and then look at the daily chart and so on.
Why 5 Motive Patterns - 3 Corrective Patterns?
Unfortunately, Ralph N. Elliott didn’t specifically explain why a complete cycle is 5-3 waves patterns at that time. He simply said that was how it was formed at that time.
This doesn’t mean that it is not effective in the current market. Instead, based on our point of view, we understand why Ralph Elliott didn’t fix a 5-3 waves pattern to be used in different eras of the financial market. Because the idea behind Elliott Wave is to tell us how the price reacts when the market’s realisation of reality is not justifiable to the value of the underlying asset.
Human nature doesn’t change, Greed & Fear is the fuel to keep the financial market moving. But the regulation, market size, & financial products change over time. Which will affect the market price volatility and price behaviour.
As long as we understand the principle of analysis, we can apply the principle to the market and react to the market greed & fear for our benefit. Like how we trained our Operator Analysis students, we focus on the principle of “how does the big fish behaves” to track these big fish intentions and we will know when to react to their next movement. So that you can fish in different oceans, rivers, or lakes.
Elliott Wave’s Entry & Exit Application
TAKE NOTE:
This strategy consists of Leading indicators that have some degree of lagging by its nature. Shall you want to achieve better entry & exit, you should rely on price & volume transaction data and movements to measure the big boys/ the market intention.
This is a concept trading plan we have used in the past. We no longer use this method as we found better ways to find the entry & exit by analyzing price & volume data to measure Big Boys intention. However, it should be sufficient for beginners to analyze potential stocks and minimize the risk at the same time. If you understand the tools that will be used in this strategy and discipline in your trading.
Analysis tools:
Elliott Wave: To identify the current trend
Price & Volume Action: To time the Entry
Stochastic / MACD: To time the Exit
Risk Management: Cut Loss level adjustment and position sizing.
Identifying the Current Trend
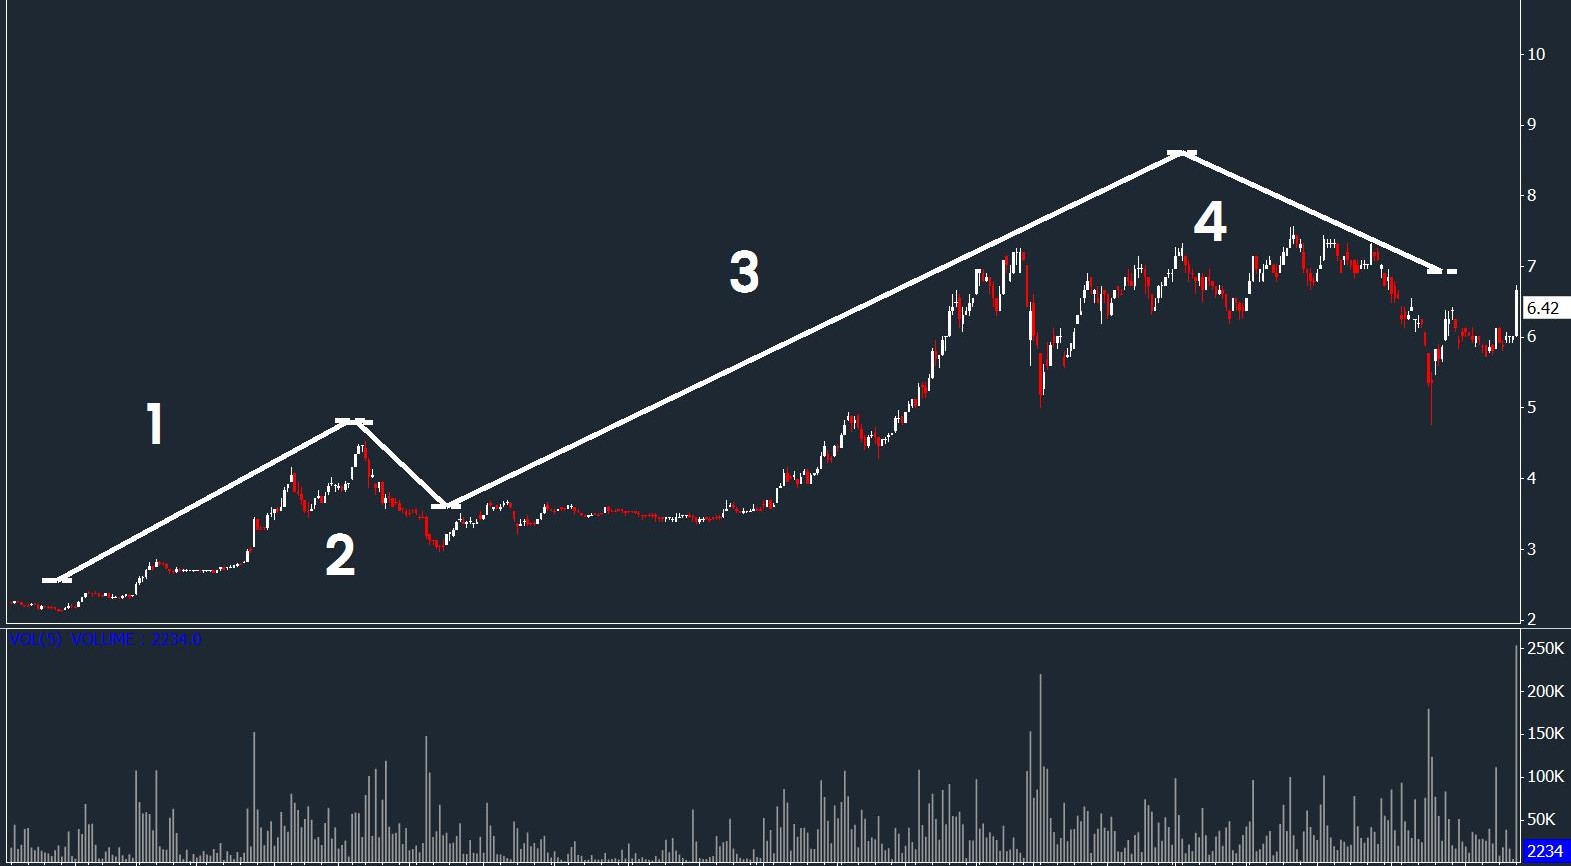
- Wait for the WAVE 4 to form (make sure it meets all the WAVES criteria).
- Make sure WAVE 4 meets the criteria of trading above WAVE 1 territory.
Entry Timing
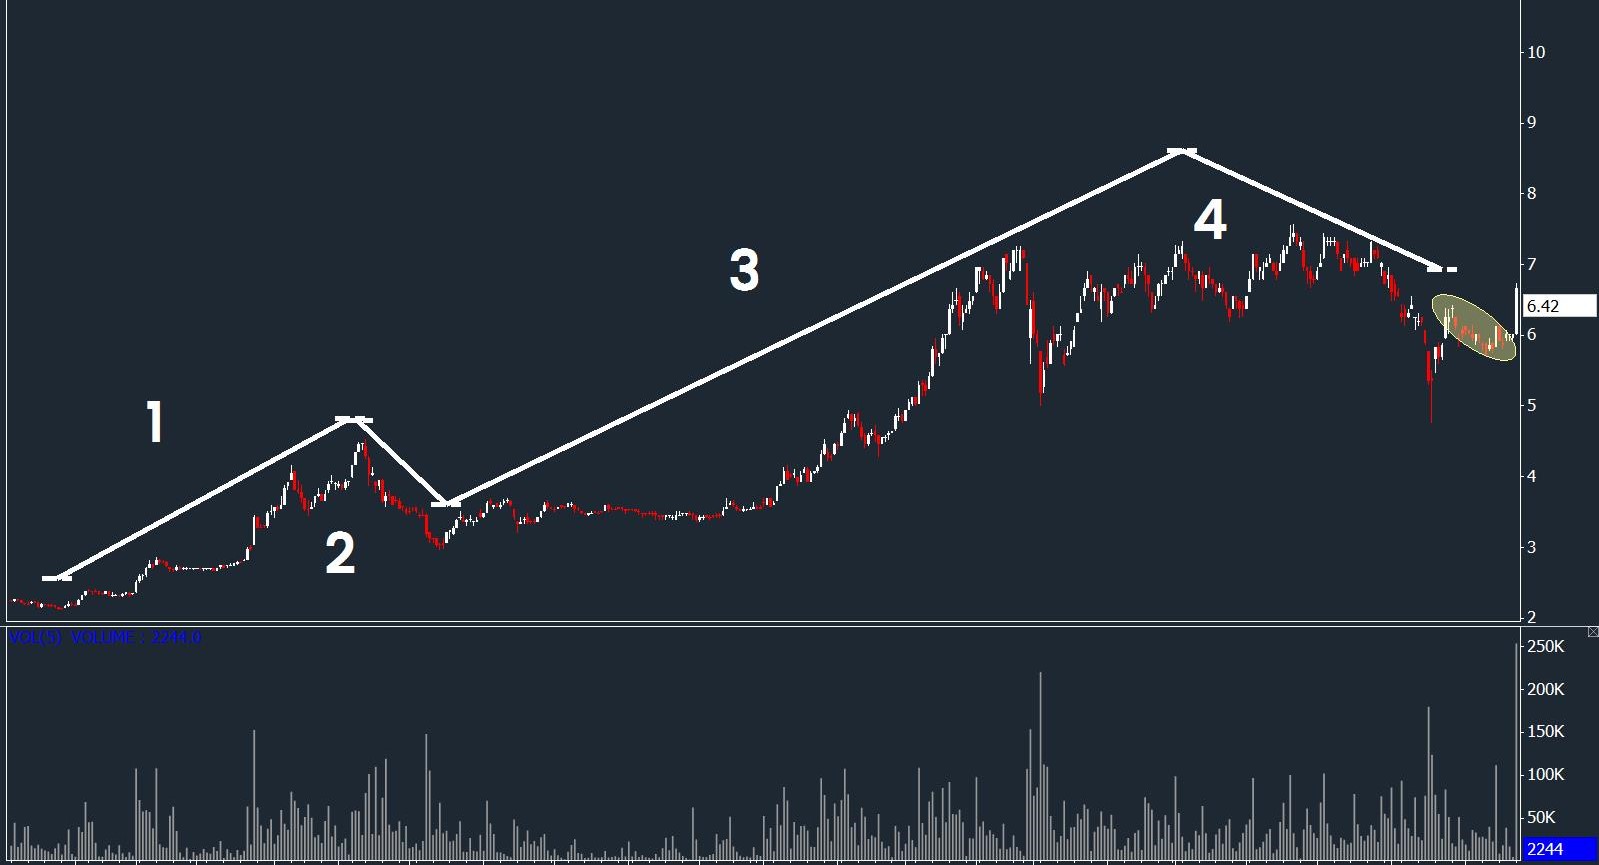
- First Entry when price retrace after a rebound at Wave 4 bottom.
- Entry when price moves up with high volume
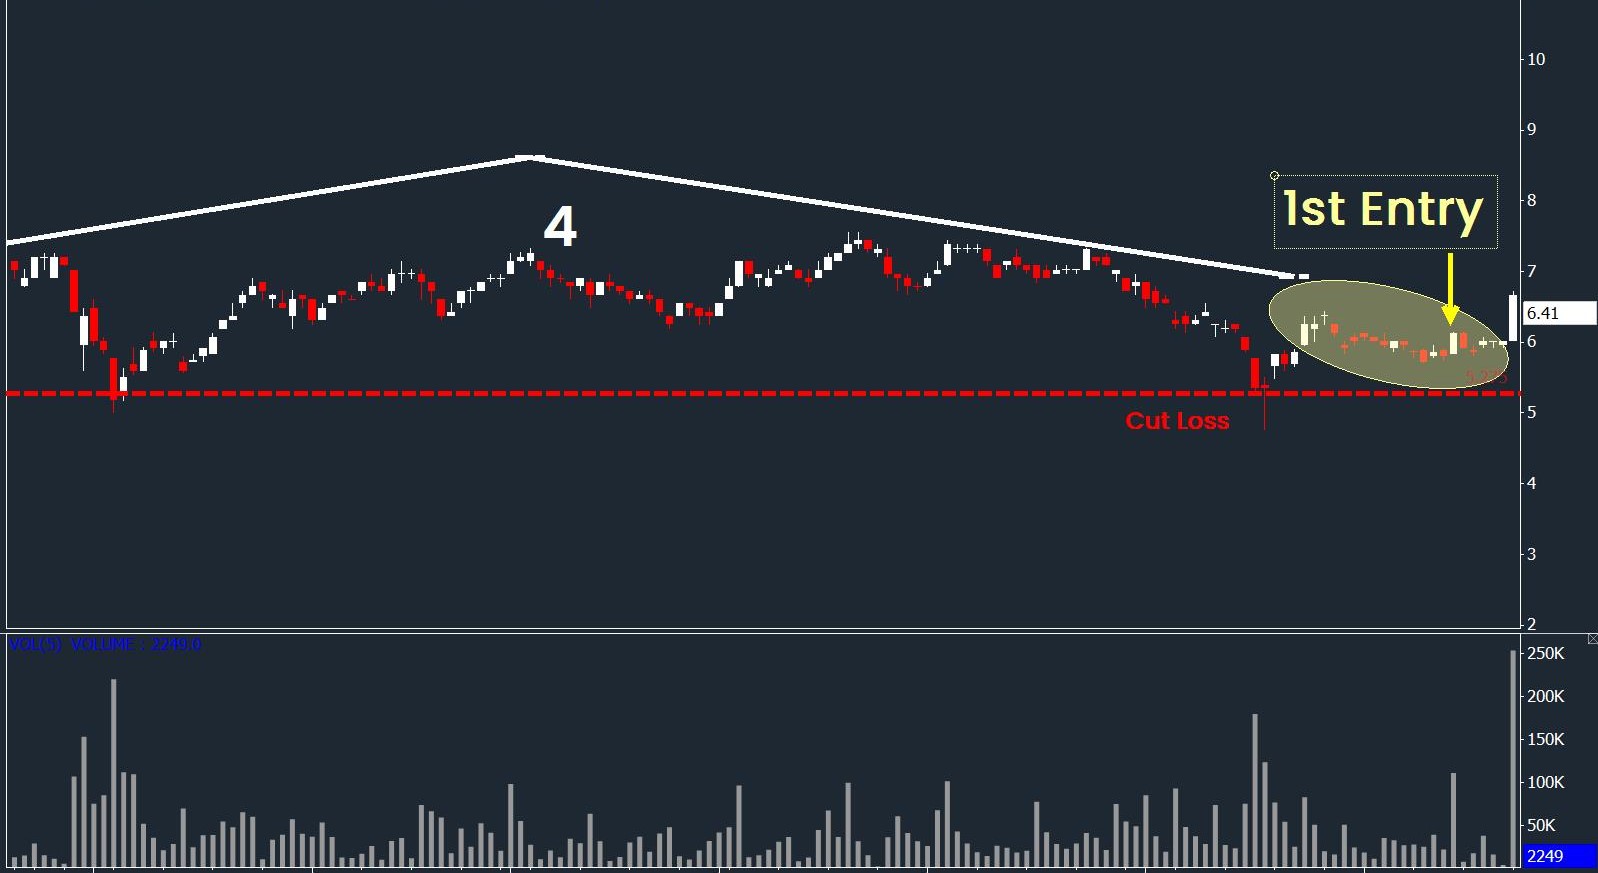
- Set Cut Loss #1 at previous Low
[To identify price rebound go to this link: https://roundnsurge.com/news/identify-market-bottom-with-price-volume-analysis-wyckoff-method]
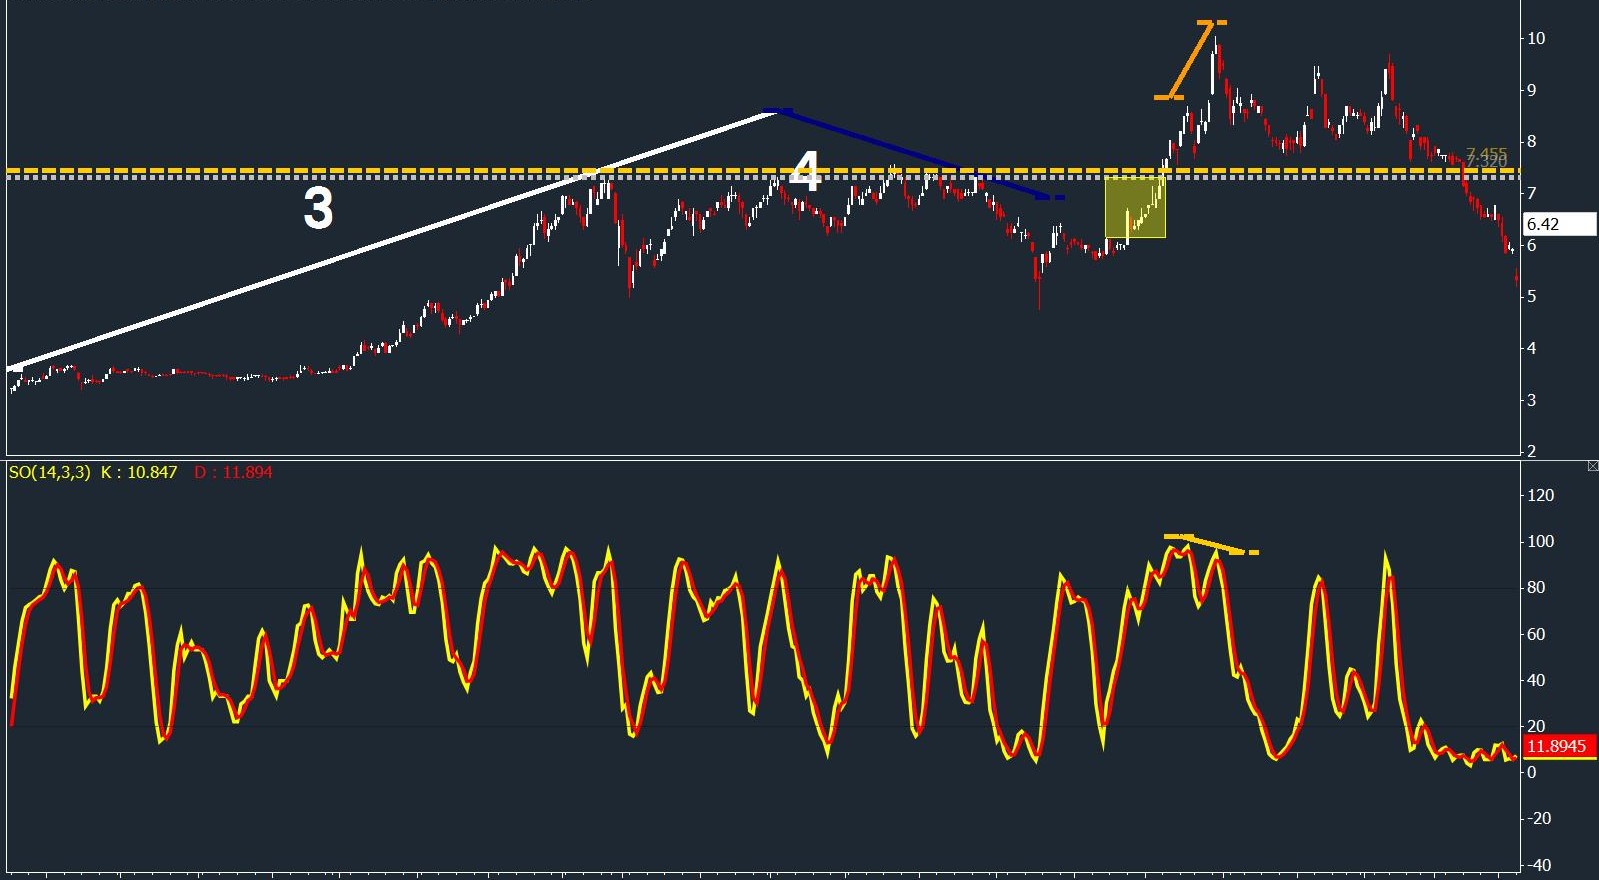
Riding the Profits

- Second Entry when price trades above WAVE 3 high.
[1st Entry position sizing should be the same as 2nd entry position sizing to lower the risk exposure.]
- Set Cut Loss #2 below WAVE 1 high & adjust Cut Loss #1 to the same level.
Prepare for the Worst

- Adjusting Cut Loss #1 to a higher level is to protect our profits and minimize the risk of 2nd Entry if 2nd Entry fails to move higher.
Time To Harvest Your Profits
- The easiest way to time the exit at Wave 5 is by applying Stochastic or MACD to identify any divergence.
Above Image: Stochastic Oscillator
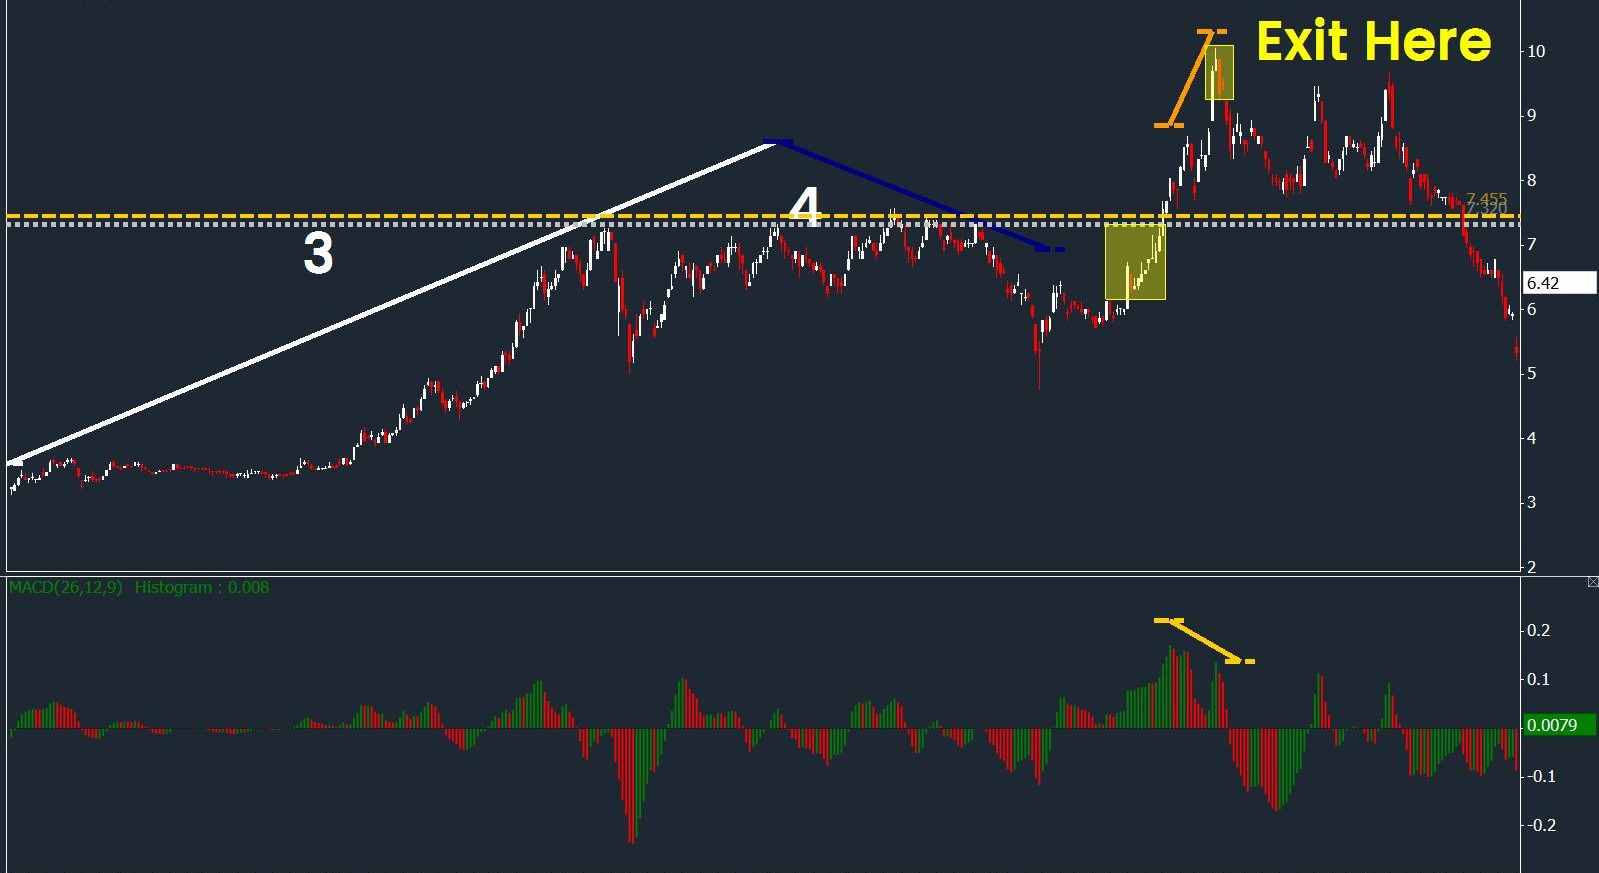
Above Image: MACD Histogram
Summary
All strategies look good when presented. The difficult part in executing a trading strategy is how much you understand the strategy and the reasons for all the price movement that triggers the exit or entry. When you understand your own “tools” in trading, it will be much easier for you to stick to your trading plan and reduce the chances of making an emotional decision.
Lastly, indicators tend to be lagging, partly because their nature is more towards telling us the current trend instead of forecasting future price movements. Because it is telling us the current market conditions, you can react to it and don’t look back if the price continues to move higher. You feel much better and won’t bend your trading strategy in the next trade. If you want to achieve better precision in entry & exit, you will need to understand and react to the big boys' intentions.
For more understanding about big boys' intentions, you may join our upcoming live stream preview in the link below.
Please give us a LIKE to support our contribution if you find this blog helpful to you. Thank you!
To find out more about our Operator Analysis Pro-Trader Course, visit this link : https://bit.ly/3NVMHfS
Website : www.roundnsurge.com
Facebook: www.facebook.com/roundnsurgeofficial
Youtube: www.youtube.com/c/RoundSurgeoperatoranalysis
Instagram: @roundnsurge
Kelvin's Instagram: @kelvinnny810
Malaysia stock market is a unique market, hence it requires a customized trading approach to tackle & swerve. Many existing traders in Malaysia apply a plug-and-play strategy from the overseas stock market, but it is not necessarily the best strategy to trade in KLSE. This is due to the difference in local and overseas stock market regulation and the size of market participants of institutional funds & retail investors.
“True traders react to the market.” is the backbone of our trading method. Our findings and strategies are developed through years of trading experience and observance of the operating style in Malaysia’s stock market.
Trading Account Opening
They are offering an IntraDay trade brokerage rate at 0.05% or RM8 whichever is higher for day trading stocks RM 50,000 & above-transacted volume (buy sell the same stocks on the same day). Buy & hold at 0.08%or RM8 whichever is higher.
Open a cash account now at the link below :
https://registration.mplusonline.com/?ref-id=R311
As Kelvin’s trading client, you will be exclusively invited to join Kelvin’s weekly webinar and telegram group. Click here to join.
For more inquiry contact him by email: kelvinyap.remisier@gmail.com or 019-5567829
If we have missed out on any important information, feel free to let us know and feel free to share this information out but it will be much appreciated if you can put us as the reference for our effort and respect, thank you in advance!
To find out more about our Operator Analysis Pro-Trader Course, visit this link : https://bit.ly/3NVMHfSTo find out more about our Operator Analysis Pro-Trader Course, visit this link : https://bit.ly/3NVMHfS
More articles on Round & Surge Operator Analysis
Understanding Support and Resistance through Big Boys Demand and Supply
Created by roundnsurge | Aug 09, 2023
"Master Support & Resistance: Trade Hang Seng with Big Player Insights. Learn to spot levels using price & volume analysis. Trade smarter, minimize risks. Watch YouTube for examples.
Maximize day trading potential returns 10%-50% a day [ Hang Seng Index : CBBC VS. STRUCTURED WARRANTS ]
Created by roundnsurge | Jun 27, 2023
Discover the differences between Callable Bull/Bear Contracts (CBBCs) and structured warrants on the Hang Seng Index (HSI) to maximize your day trading returns.

Why Traders Are Switching to CBBCs from Stocks, CFD Forex, Cryptocurrency, and Futures Contracts
Created by roundnsurge | May 22, 2023
Discover the incredible profit potential of Callable Bull/Bear Contracts (CBBC). The ability to profit in rising and falling markets, and lower entry barriers make CBBC the superior choice for trader.
The Shortcut to Success: Short-Term Trading Strategies for KLSE and SGX
Created by roundnsurge | Apr 17, 2023
Identify profitable rebound stocks by following big players' support during downtrends & retracement understanding their marking of price levels in this short-term trading strategy for KLSE & SGX.

Boost Your Income With Trading: Building for the Future vs. Living for the Now
Created by roundnsurge | Apr 05, 2023
Unlock your financial potential with investment and trading strategies for building current and future income.

From Losses to Consistent Profits: An Insider's Guide to Overcoming Trading Experience in the Stock Market
Created by roundnsurge | Feb 04, 2023
Being able to accept our losses is the first step in being able to learn from them and turn that into future profit!
KLSE Day Trading | How to read big boys transaction to make profit | R&S Training class [Cut Scene]
Created by roundnsurge | Jan 29, 2023
We're going to give you an insider's look at how the big boys get their info and make trades, so that you can do it too!

Trading Technique To Find Best Entry & Exit for 2023 Top Stocks
Created by roundnsurge | Jan 12, 2023
We can’t avoid big boys in the stock market, so we learn how they operate & take advantage of their price movement for our better entry & exit.
Discussions
Be the first to like this. Showing 0 of 0 comments
Post a Comment
Featured Posts


Latest Videos


Apps


Top Articles
1
https://dividendguy67.blogspot.com
2
save malaysia!
3
save malaysia!
4
5
Koon Yew Yin's Blog
6
南洋 - 凭单专栏/温世麟
7
PublicInvest Research
#
Stock
Score
Daily Stocks
Stock Name
Last
Change
Volume
Stock Name
Last
Change
Volume
Stock Name
Last
Change
Volume
MQ Trading Signals
Stock
Time
Signal
Duration
Stock
Time
Signal
Duration
Featured Advertisers / Partners


Ride The Bull Short The Bear
CS Tan
4.9 / 5.0
This book is the result of the author's many years of experience and observation throughout his 26 years in the stockbroking industry. It was written for general public to learn to invest based on facts and not on fantasies or hearsay....