


Stock Pick Challenge 2013 2H
Stock Pick Challenge - [HAPSENG-WA] by OTB

Dear valued members,
You should be realistic about your goals.
"In this business if you're good, you're right six times out of ten. You're never going to be right nine times out of ten." Peter Lynch
Disclaimer: Please be informed that the following mentioned stocks / symbols are solely for the purpose of education only; it is neither a trading advice nor an invitation to trade. For trading advice, please speak to your dealer representative or remisier or financial adviser. Please buy at your own risk. Final decision is yours.
The 10th stock I wish to select for second half of 2013 is HAPSENG-WA.
My trading plan
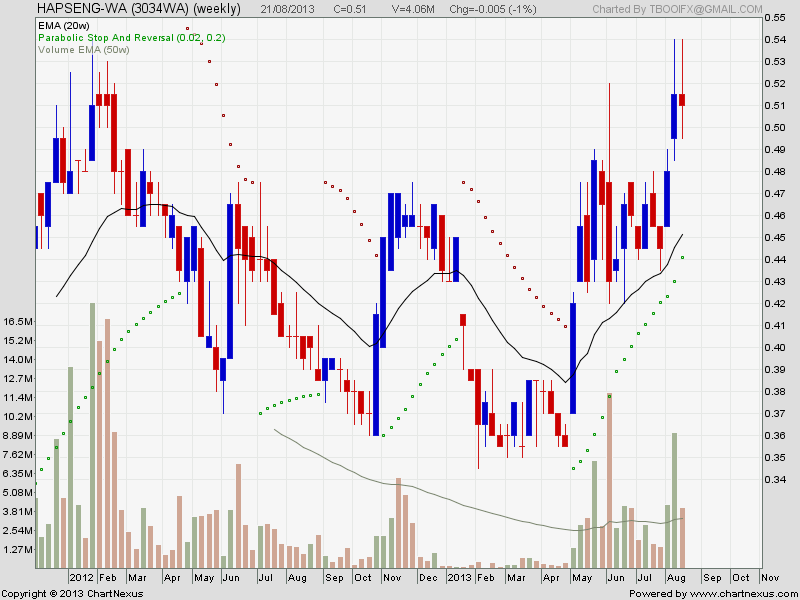
This stock is an up trending stock (daily, weekly and monthly).
The stock price was hitting all time high at 0.54 on 20/8/2013. The price retraced and closed at 0.51 on 21/8/2013.
Major resistance is 0.54.
Major support is 0.42.
Target price = 1.86.
Margin of safety = 74%
Potential profit gain = 288%
Cut loss at 0.40 = 16.6%
Risk reward ratio at 0.40 cut loss = 1 : 17.25.
Recommendation from CIMB : Target price for Hap Seng (mother)is 2.89, Hap Seng-WA is 1.49.
Note:
The target price at 1.86 is based on Technical Analysis calculation.
Technical Chart.
A very nice up trending chart formed. There will be a good chance to hit our target price of 1.86 if the major resistance at 0.54 is crossed convincingly. The chart is very bullish and the sky is the limit (my slogan only) if 0.54 is crossed convincingly. I like this chart because the price is at a new high.
Conclusion
I was very happy that the market sentiment was bad on 22/8/2013 so that I can buy at a bargain price of 0.48. Recommend to buy at 0.48 on22/8/2013.
| Hap Seng IV Calculation | |||||
| Fundamental Rating | |||||
| Total Net Profit Years | 10/10 | 62.50% | |||
| Total Positive Operating Cash flow Years | 4/10 | ||||
| Total Dividend Payout Years | 9/10 | Current Price | |||
| Total Positive free Cash flow Year | 2/10 | 2.11 | |||
| 25/40 | |||||
| Growth% | |||||
| 10 Years Average Turn Over | 2354133 | ||||
| Latest 4 quarters | 3765098 | 59.94% | |||
| 10 Years Average Net Profit | 281004 | ||||
| Latest 4 quarters | 537927 | 91.43% | |||
| 2011 | 2012 | 2013 | Growth% | ||
| EPS (Cent) | 18.85 | 19.58 | 25.44 | 29.93% | |
| PER | 11.19 | 10.78 | 8.29 | 23.03% | |
| NTA | 1.51 | 1.61 | 1.63 | 1.24% | |
| Net Profit | 375602 | 422632 | 537927 | 27.28% | |
| Equity | 3293417 | 3398641 | 3715118 | 9.31% | |
| ROE | 11.41% | 12.44% | 14.48% | 16.39% | |
| Dividend | 8.6 | 10.5 | |||
| Free cash flow | -492580 | 510708 | |||
| Price CAGR % (Buy and Hold) | |||||
| Average Return History | 8.59% | ||||
| 3 yrs Return | 35.99% | ||||
| Method 1 | |||||
| EPS | 0.25 | ||||
| g | 15.00 | ||||
| Y | 7.0 | ||||
| IV= (EPS*(8.5+1.5g)*4.4)/Y | 4.96 | ||||
| Current price | 2.11 | ||||
| Margin of Safety | 57.44% | ||||
| Potential gain | 134.94% | ||||
| Method 2 | |||||
| Discounted Cash Flows Calculator | |||||
| Discount rate | 12.00% | ||||
| EPS | 0.25 | ||||
| Earning expected to grow (annually) | 15.0 | ||||
| for the next (? Years) | 3.0 | ||||
| before leveling off to an annual growth | 3.00 | ||||
| Calculate Stock Value per share | 3.89 | ||||
| Current price | 2.11 | ||||
| Margin of Safety | 45.76% | ||||
| Potential gain | 84.36% | ||||
| Method 3 | |||||
| ROE | 14.48% | ||||
| Rr | 8.00% | ||||
| NTA | 1.63 | ||||
| IV= ROE/ Rr*NTA | 2.95 | ||||
| Current Price | 2.11 | ||||
| Margin of Safety | 28.48% | ||||
| Potential gain | 39.82% | ||||
| Method 4 | |||||
| (22.5*EPS*Book value per share)^0.5 | |||||
| EPS | 0.25 | ||||
| Total equity | 3715118 | ||||
| Number of shares | 2186537 | ||||
| (22.5*EPS*Total Equity/share)^0.5 | 3.12 | ||||
| Current price | 2.11 | ||||
| Margin of Safety | 32.34% | ||||
| Potential gain | 47.80% | ||||
| Warrant | |||||
| HapSeng-WA | |||||
| Expiration date | 8/9/2016 | ||||
| Exercise price | 1.65 | ||||
| Price of Mother share | 2.11 | ||||
| Intrinsic value of WA | 0.46 | ||||
| Actual price of WA | 0.51 | ||||
| Premium or Discount | 2.37 | ||||
| Gearing | 4.1 | ||||
| Conclusion | |||||
| If the price of Hap Seng is 3.20, the price of Hap Seng-WA should be (3.20 - 1.65) = 1.55. | |||||
| If it is trading at 20% premium, the price of Hap Seng-WA should be (1.55*1.2) = 1.86. | |||||
| Potential gain = (1.86 - 0.48)/0.48*100 = 288%. | |||||
| Special note: | |||||
| I bought HapSeng-WA at 0.48 on 22/8/2013. | |||||
Related Stocks
| Chart | Stock Name | Last | Change | Volume |
|---|
More articles on Stock Pick Challenge 2013 2H
So what is wrong with the pick on Kumpulan Fima which lost 2.4% since a year ago? - kcchongnz
Created by Tan KW | Jan 02, 2014
Hexza and Graham net-net and high dividend yield investing strategy - kcchongnz
Created by Tan KW | Nov 08, 2013
Graham Net-Net Investment Strategy and some property companies - kcchongnz
Created by Tan KW | Sep 06, 2013
Discussions
4 people like this. Showing 10 of 12 comments
Please read the below link. Thank you.
http://klse.i3investor.com/servlets/ptg/3034.jsp
2013-08-22 21:51
Dear Mr Tan KW,
My reference price for Hapseng-WA should be 0.48. Thank you.
2013-08-22 22:44
OTB, if you may understand, KW always use the previous day closing price as the reference price, not the price which you purchased. This is to ensure a level playing filed for transparency and standardization purposes.
2013-08-23 07:13
KW Tan, I think you are not consistent with your reference price as you are the one who mentioned that it is based on the previous day closing or prevailing day's opening.
2013-08-23 10:03
For the purpose of fairness, consistency and transparency the reference price should also be based on a certain benchmark or criteria and in this case should be on the previous day closing as the prices can fluctuate within a wide range during the trading day. It does not matter if the price purchased is lower or higher than the previous day close. Thus is this case the previous close was 51 sen and even in the event that otb bought at 53 sen, the reference price should be 51 sen. And this is basically what happened as in Pintaras as selected by kcchongnz.
2013-08-23 10:15
As I said it would be preferable to let i3 set the reference price to ensure fairness to both kcchong and otb. At least there is a standard basis.
2013-08-23 10:37
Chill... reference watchlist only... even it reach that price doesn't mean one can buy at that price as volume varies... only a buy sell portfolio is more accurate when judging performance... 2cents...
Let's continue to share and prosper...
2013-08-23 15:15
Post a Comment
Featured Posts


Latest Videos


Apps


Top Articles
1
Stock Market Enthusiast
YTLPOWER: Reversal Ahead? Hammer + MACD Crossover Pattern Emerging... KingKKK
2
Trendindicator
3
4
5
6
8
BFM Podcast
#
Stock
Score
Daily Stocks
Stock Name
Last
Change
Volume
Stock Name
Last
Change
Volume
Stock Name
Last
Change
Volume
Featured Advertisers / Partners


Ride The Bull Short The Bear
CS Tan
4.9 / 5.0
This book is the result of the author's many years of experience and observation throughout his 26 years in the stockbroking industry. It was written for general public to learn to invest based on facts and not on fantasies or hearsay....
jalenheng
The target price by climb is on hsplant,not hapseng
2013-08-22 21:02