The Tale of Two Companies - Profit Margin
teoct
Publish date: Tue, 11 Jun 2019, 10:32 PM
A Tale of Two Companies
Dayang & Perdana – Profit Margin
It was the best of times, it was the worst of times, it was the age of wisdom, it was the age of foolishness, it was the epoch of belief, it was the epoch of incredulity, it was the season of Light, it was the season of Darkness, it was the spring of hope, it was the winter of despair, we had everything before us, we had nothing before us, we were all going direct to Heaven, we were all going direct the other way—in short, the period was so far like the present period, that some of its noisiest authorities insisted on its being received, for good or for evil, in the superlative degree of comparison only – Charles Dickens: A tale of two cities.
Recap - Revenue
Perdana is predicted to have a revenue of RM 226M for financial year 2019.
Dayang estimated revenue for financial year 2019 is RM 951M of which RM 137M will be from Perdana.
Now, revenue is only one part of the story. The other part is profit margin (net) that will determine the net profit, thus, EPS (earning per share). IBs call theirs EARNINGS. Straight to the point, no need to look at finance expense / earning and tax as to me this are not going to change too much.
Perdana
So, onward to determine the (net) profit margin.
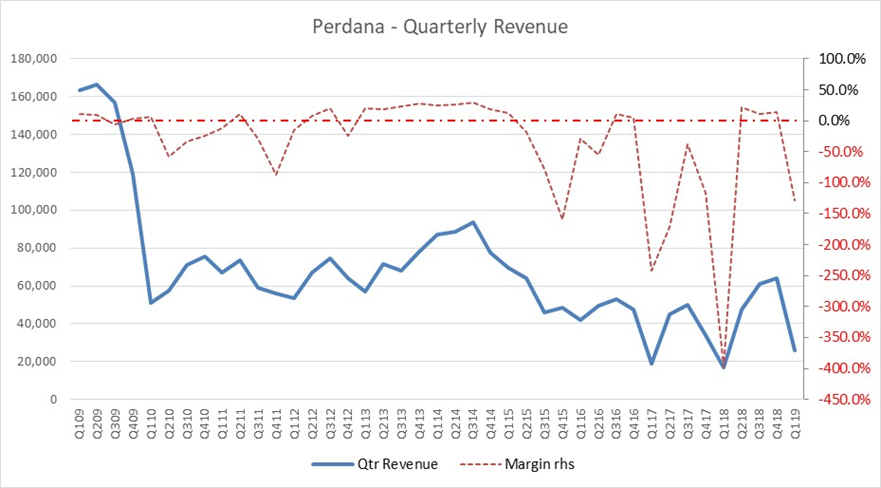
I love graph, it focuses the mind.
As one can see, it is very difficult to predict Perdana profit margin. So, the best one can hope for, is there will be no losses this 2019. Why, because, Q1 2019 EPS, -4.23, is 49% less than -8.56 of Q1 2018, see below. The subsequent (2018) quarters were positive, and 2019 Q2 to Q4 should not be different and should be more than 2018.
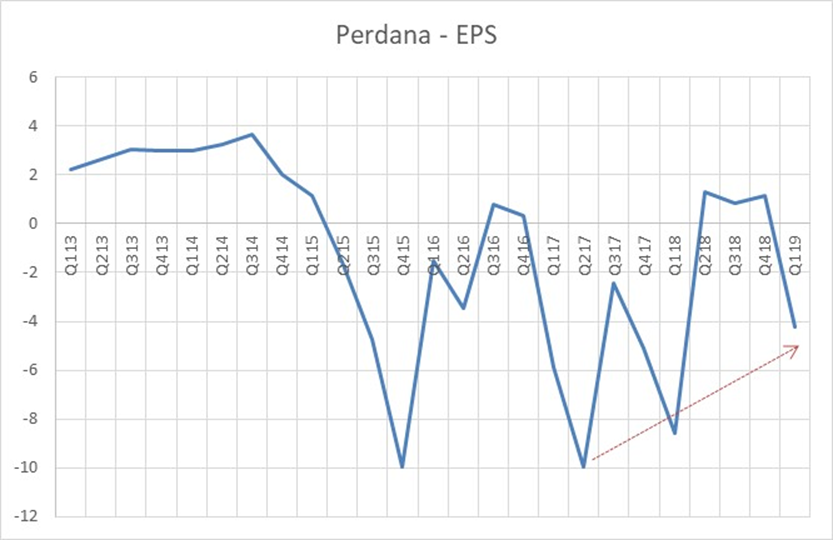
Let us be conservative and just say that Perdana will not make money neither will it lose money, so the transfer to Dayang will be just 60.48% of zero, i.e. 0.
Dayang
Again, here are this year, IBs’ revenue and earnings: -
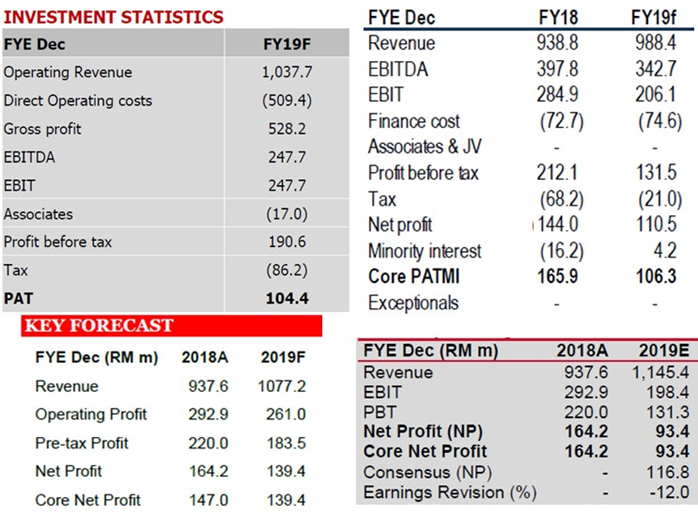
The IBs are bullish on revenue, their average, RM 1,062M, is 13% more than RM 939M of 2018.
IBs (net) profit margin, however, is 8.2%, 10.1%, 11.2% and 12.9%, bearish. Are these profit margins reasonable? NO. Why not, let’s consider the following data: -
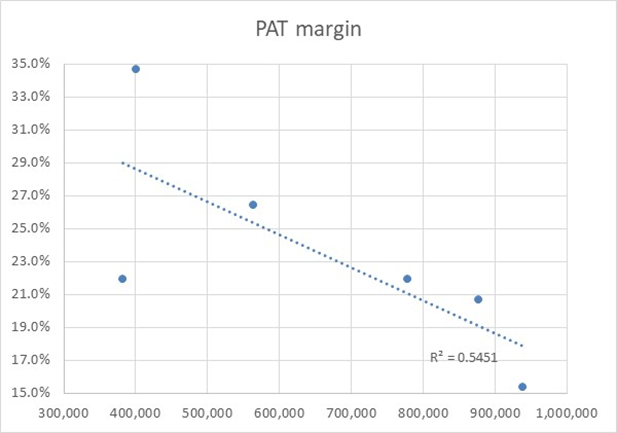
This is the historical (net) margins for 2011 to 2015 and 2018. Year 2016 and 2017 were excluded as the margin 7.9% and -20.7% are considered not representative.
Don’t forget, 2018 result, Dayang had to carry 60.48% of Perdana RM -41M loss, i.e. RM -24.8M that brought the net profit margin down to 15.3% from an estimated 20.5%. A 5% difference.
Remember, Perdana this year will transfer 0 profit to Dayang, not a loss! So, margin should be nearer to 20%, let us see what else could reduce margin.
What are the factors that will affect the margin?
- Cost of material – steel a major component of offshore materials should be relative similar or lower in cost as can be seen in the poor results of steel counters on the Bursa recently.
- Cost of manpower – the many laid off welders, scaffolders, general workers during the 2015 to 2017 would welcome the work now. Okay there might be some increase, shall we say about 4%.
- Cost of vessel charter rate – again from Perdana many reports, rates is only just climbing, and they are climbing from a very low base, meaning rates had dropped a lot in the period 2015 to 2018, yes 2018 as Perdana still making loss, remember.
- Changes in regulations – so far, there is no news that there are any changes that affect cost at all.
- Impairment – 2018, Dayang wrote back RM 20M! To impair in 2019, with such high activities for both Dayang and Perdana, this would be highly improbable consequential event.
- Unusual adverse weather – low possibility for Q2 & Q3 as all IBs think so too; they have estimated revenue – RM 988M to RM 1,145M that is higher than 2018 RM 938M.
- Known unknown and unknown unknown – well these (strike for instance, tropical storm?) are all possible but of very low probability.
As manpower cost (probably) make up 30% of total cost, a 4% increase would only increase total cost by 1.2%.
Yes, there were mention that current contracts rate is lower than those of 2013, but cost like vessel charter rates are much lower, material cost should be lower too, fuel cost is also lower, thus overall margin should stay relatively the same.
Average margin for 2014 to 2018 (omitting negative value) is 20%. Thus, a lower margin of 18% (20 less 1.2 with round-down) would have been palatable compared with IBs’ 8.2% to 12.9%.
Dayang reports two segments, topside maintenance services and marine offshore support services. Perdana 2019 result should be good, zero (no loss) transfer to Dayang, so let’s look at the profit margin of ONLY the topside maintenance services.

Removing the three outliers will give the gross margin at a constant 23% (for all purpose and intent despite the slight slope to lower margin). Q1 2019 TMS gross margin came in at a higher 26.6%.
With lower interest payment and higher tax (higher gross profit) about cancel out, net profit margin should hover around 18%.
Average IBs revenue: RM 1,062M
Net margin 18% gives: RM 191M (potential) compared with RM 93.4M to 139.4M
Summary
- Dayang own 60.48% of Perdana. 60.48% of Perdana’s profit or loss will be transferred to Dayang.
- 2019 will be a good year for Perdana. Being conservative, Perdana will not make money nor losses, so zero (0) profit will be transferred to Dayang.
- Dayang average net margin from 2014 to 2018 (ignoring 2016 and 2017) is 20%.
- The topside maintenance service gross margin is about 23% over the 2013 to 2018 period. Q1 2019 topside maintenance service margin is 26.6%. This gives confident that net margin should be relatively stable at 20%.
- Current contract rates expected to be lower compared to 2013, but material cost, vessel chartering cost and fuel cost are all lower.
- With only manpower cost expected to be higher (compared to 2013 period), net margin is expected to be lower, 18% to account for this.
- This 18% is much better than IBs margins of between 8.2% and 12.9%
- This would give earnings of RM 191M compared with the low RM 93.4 to RM 139.4 (EPS 9.7 to 14.4 sens)
Conclusion
Perdana, currently has 9 contracts worth RM 220M, will do well this year. There should be zero losses to be transfer to Dayang, likely a profit. Nevertheless, zero is taken, to be conservative.
Topside maintenance services quarterly gross margin is 23% over the period 2014 to 2018 (exclude three outlier data points). Quarter 1 2019 gross margin came in at a respectable 26.6%. This added confident to the average net margin of 20% for year 2014 to 2018 (excluding year 2016 & 2017).
IBs estimated that Dayang 2019 revenue average RM 1,062M, a bullish call. However, their net margin is a (weighted) 11% only, giving calculated Earning of RM 112M and EPS of 11.6 sens.
It is argued that despite lower contract rates for current contracts, the much lower vessel chartering rates, lower material cost and fuel cost should allow Dayang to maintain a respectable margin of 18% despite allowance for manpower (only) cost increase of 4%. And with my estimated slightly lower revenue of RM 951M, but, the EPS is anticipated to be 17.7 sens.
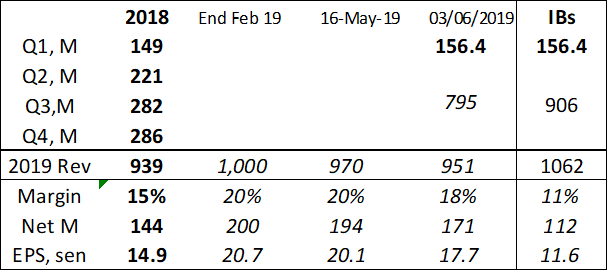
The forecast: - Revenue = RM 951M (± 5%) & net profit margin = 18%. There is a 80% chance that the actual revenue and profit margin will be as per forecast. There still is a 20% chance that actual revenue and margin might be less than as forecast.
Finally, will the debt restructuring affect EPS, stay tune.
Epilogue
The market is like "GOT", no quarters given. Super quick reaction to news - "impeccable" foresights of "investors" to rights issues and first quarter losses. What's change, nothing much really.
It also gives opportunity to those that miss out earlier, like the 3,000 shares acquired by a Director recently at RM 0.88 per share; seem small investment, but a 66% increase from his holding of 4,500 shares on 29/3/19.
I hope to be Bran that can "see" into the future (forecasting skill) rather than Jon that is exiled to the cold and wilderness.
Point to muse
Why did some of the IBs reduce earning after Q1 2019 rather than reduce the revenue?
This is like Singapore changing their currency fluctuation band instead of interest rate like most countries do.
Appreciate readers constructive critique so that margin can be more accurate with “wisdom of the crowd” (as oppose to madness of the crowd). Many thanks. Disclaimer as before.
Related Stocks
| Chart | Stock Name | Last | Change | Volume |
|---|
Market Buzz
2025-01-06
DAYANG2024-12-31
PERDANA2024-12-31
PERDANA2024-12-31
PERDANA2024-12-31
PERDANA2024-12-31
PERDANA2024-12-31
PERDANA2024-12-31
PERDANA2024-12-27
DAYANG2024-12-27
DAYANG2024-12-27
DAYANG2024-12-27
DAYANG2024-12-26
DAYANG2024-12-26
DAYANG2024-12-26
DAYANG2024-12-26
DAYANG2024-12-26
DAYANG2024-12-25
DAYANGMore articles on TeoCT
Created by teoct | Jul 23, 2020
Discussions
thumbs up and pls keep up the good work....truly appreciate it.
Even thou i don't hold much of this counter, but it is always a pleasure to read such factual, systematic, clean and easy to understand analysis. Thanks again
2019-06-12 09:31
Great work teoct. I love reading your articles.
I would like to share a bit of my thoughts.
I think there is no need to put much attention into the cost of materials and manpower. You can find that the inventory level in the balance sheet is minimal at around 6-7m only. Manpower will not be the determining factor for the volatility of the profits as well because as you mentioned, there is ample supply of manpower in the current market. The cost of manpower will be stable. Furthermore, as the manpower is paid based on daily rates, the will be no cost to Dayang when there is no job.
What determines the profitability of Dayang is their work load. When there is low work load, the utilisation of Perdana's vessel will take a hit as the jobs done by Dayang requires support from the vessels. If you look into Perdana's income statement, you will realise what I mean.
The most important thing for Dayang now is their work load and Perdana vessels' utilisation and charter rate which is difficult to predict.
Keep up the good work!
2019-06-12 15:26
Awesome, many thanks for the kind words all.
Ong8888, yes point noted. Thank you very much.
2019-06-12 16:16


probability
i like the systematic, thesis like analysis incorporating the odds factor presented by teoct...
teoct is certainly one of the treasurable assets of i3
2019-06-11 23:39