


TradeVSA - Case Study
Hidden Potential Buying - MY E.G. (0138.KL)

Here are some clues to spot hidden potential buying from Smart Money based on Volume Spread Analysis:
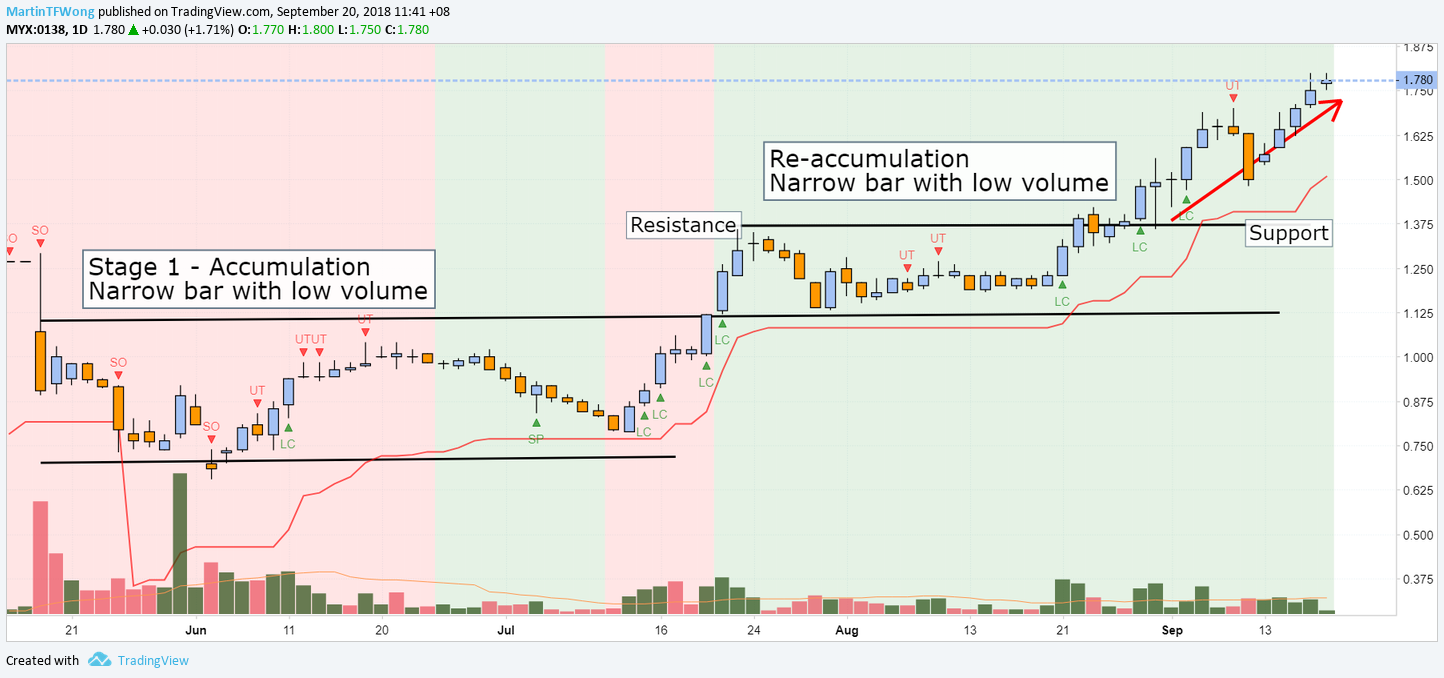
1. 2 months of Accumulation (Stage 1) after a massive sell off on 17 May 2018
2. Well supported with lots of narrow bar and low volume
3. Re-accumulation happened from July to August with narrow bar and low volume
4. Sign of Strength such as Spring, Line Change and Cluster of Closes are spotted on the support level
![]()
![]()
Related Stocks
| Chart | Stock Name | Last | Change | Volume |
|---|
More articles on TradeVSA - Case Study
Chinese Internet Stock (HKSE) Crackdown – Is it an opportunity for investors?
Created by TradeVSA | Nov 01, 2021
3 Revenue Stream You Must Look into KLSE Energy Sector Before You Buy!
Created by TradeVSA | Oct 15, 2021
AirAsia – Is this a time to look into AirAsia for Economy Reopening & its new business development ?
Created by TradeVSA | Oct 06, 2021
Discussions
Be the first to like this. Showing 0 of 0 comments
Post a Comment
Featured Posts


Apps


Top Articles
1
https://dividendguy67.blogspot.com
2
3
4
6
Kenanga Research & Investment
7
Good Articles to Share
8
Good Articles to Share
Sydney house fire kills three children, police suspect homicide
#
Stock
Score
Daily Stocks
Stock Name
Last
Change
Volume
Stock Name
Last
Change
Volume
Stock Name
Last
Change
Volume
Featured Advertisers / Partners


Ride The Bull Short The Bear
CS Tan
4.9 / 5.0
This book is the result of the author's many years of experience and observation throughout his 26 years in the stockbroking industry. It was written for general public to learn to invest based on facts and not on fantasies or hearsay....