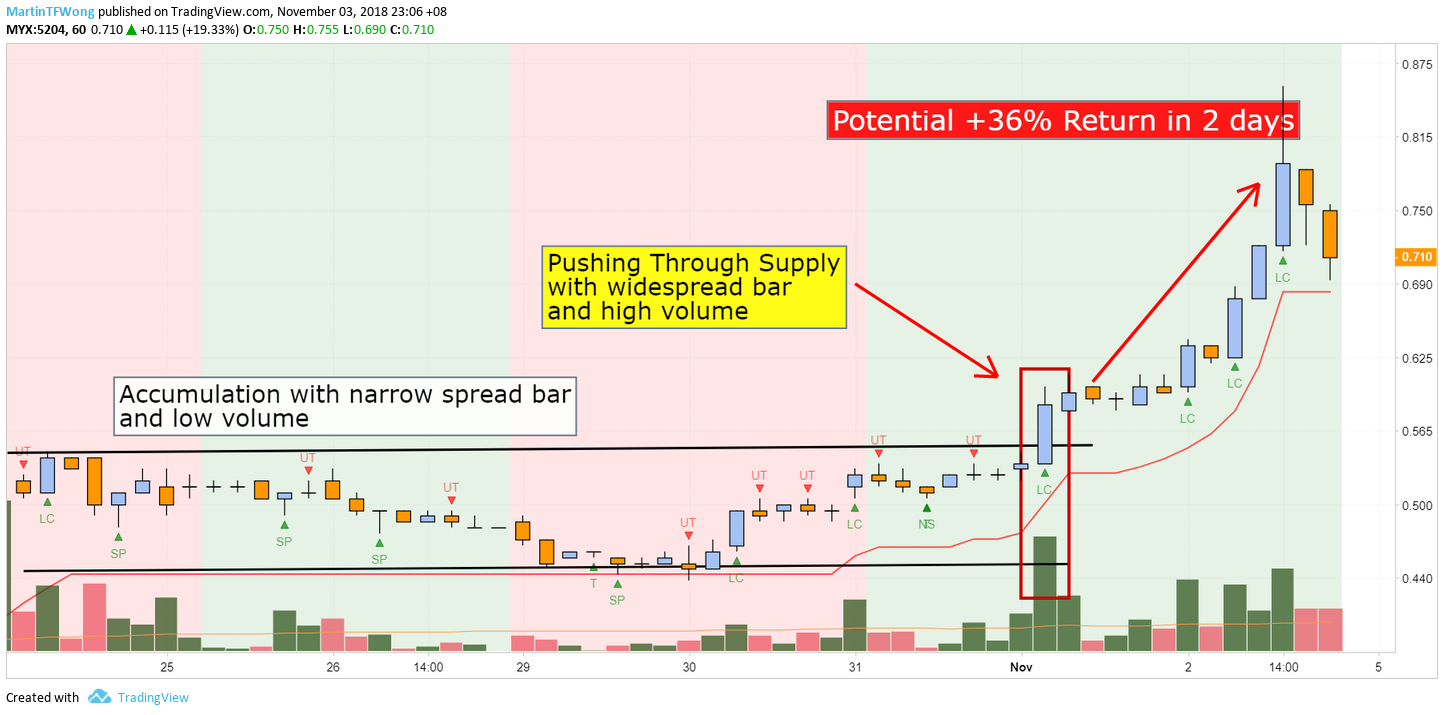
Opportunity in KLSE Using Hourly Chart with +36% Return in 2 days – Prestariang (5204.KL)
TradeVSA
Publish date: Sat, 03 Nov 2018, 11:36 PM

Based on hourly chart above, Prestariang formed a classic Volume Spread Analysis buy setup. 18 Line Change signal is spotted (as highlighted in red box) after accumulation stage with high volume. The increases in volume indicates smart money is locking up the weak-hand holders.
Notice there were no Sign of Weakness after the price break above the resistance level. Currently price is pulling back to support level. Look for Spring, No Supply or Test signals to confirm the pullback.
Interested to learn more?
· Follow & Like us on Facebook via: https://www.facebook.com/MartinTFWong/
· FREE Webinar, 10 November (Sat), 2pm: http://bit.do/tradevsa
· Visit our website for FREE Stock Screener: https://tradevsa.com/
· Contact us via: email at support@tradevsa.com or Call/WhatsApp at +6010 266 9761
More articles on TradeVSA - Case Study
Created by TradeVSA | Nov 01, 2021
Created by TradeVSA | Oct 15, 2021
Created by TradeVSA | Oct 06, 2021


Alex™
article too late. buy first, publish later
2018-11-04 14:37