


TradeVSA - Case Study
Continuation of Mark-Down Stage in FKLI Chart

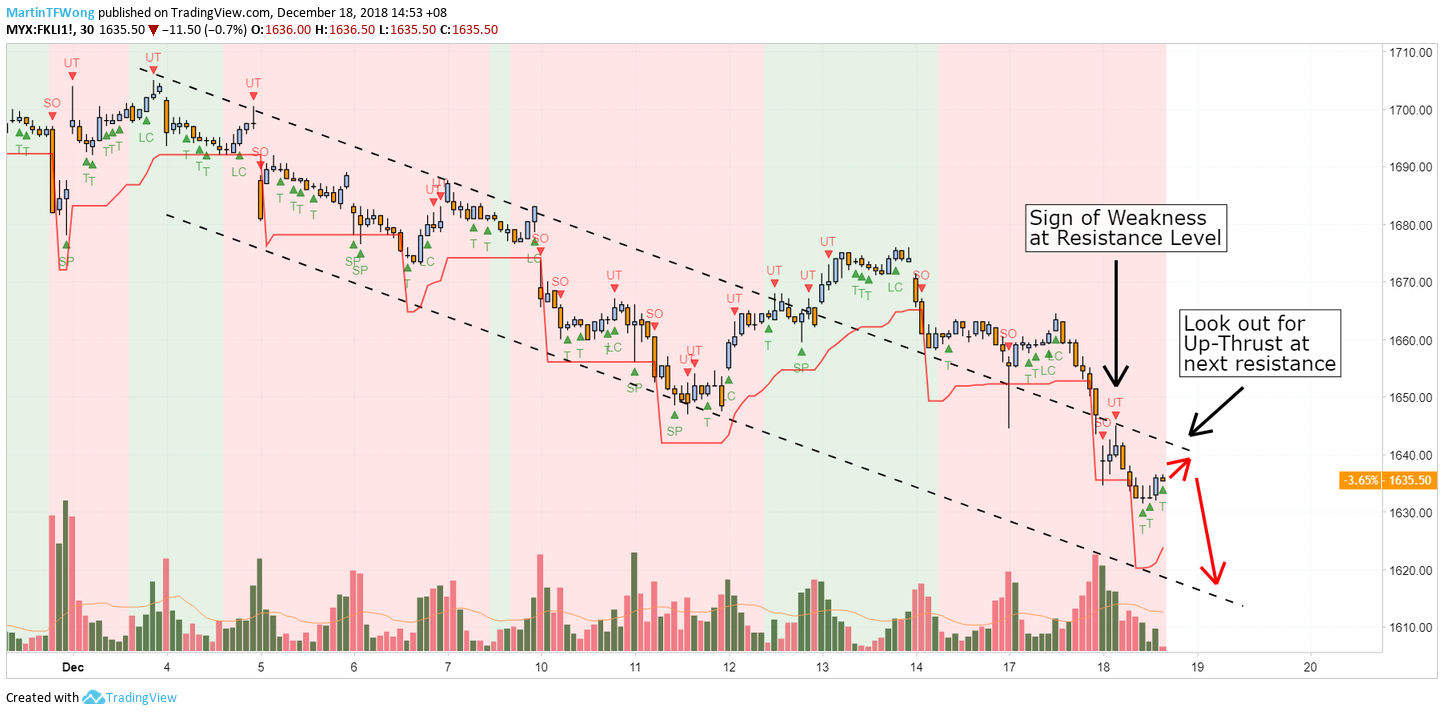
FKLI chart continue to show weakness with the continuation of mark-down stage after re-distribution. Notice a huge Sell-Off bar follow by Up-Thrust pushes the price back to the trend line.
Based on 30-minute FKLI chart, we’ll continue to short with the next Sign of Weakness (Up-Thrust) at resistance level.
Send us your preference stock to review based on TradeVSA chart by comment at below.
Interested to learn more?
· FREE Workshop, 29 December (Sun), 2pm: https://bit.ly/2rsig9p
· Visit our website for FREE Stock Screener: https://tradevsa.com/
· Contact us via: email at support@tradevsa.com or Call/WhatsApp at +6010 266 9761
Disclaimer
This information only serves as reference information and does not constitute a buy or sell call. Conduct your own research and assessment before deciding to buy or sell any stock
More articles on TradeVSA - Case Study
Chinese Internet Stock (HKSE) Crackdown – Is it an opportunity for investors?
Created by TradeVSA | Nov 01, 2021
3 Revenue Stream You Must Look into KLSE Energy Sector Before You Buy!
Created by TradeVSA | Oct 15, 2021
AirAsia – Is this a time to look into AirAsia for Economy Reopening & its new business development ?
Created by TradeVSA | Oct 06, 2021
Discussions
Be the first to like this. Showing 2 of 2 comments
Post a Comment
Featured Posts


Apps


Top Articles
1
https://dividendguy67.blogspot.com
2
3
4
6
Kenanga Research & Investment
7
Good Articles to Share
8
Good Articles to Share
Sydney house fire kills three children, police suspect homicide
#
Stock
Score
Daily Stocks
Stock Name
Last
Change
Volume
Stock Name
Last
Change
Volume
Stock Name
Last
Change
Volume
MQ Trading Signals
Stock
Time
Signal
Duration
No trading signals available.
Stock
Time
Signal
Duration
No trading signals available.
Featured Advertisers / Partners


Ride The Bull Short The Bear
CS Tan
4.9 / 5.0
This book is the result of the author's many years of experience and observation throughout his 26 years in the stockbroking industry. It was written for general public to learn to invest based on facts and not on fantasies or hearsay....
UnicornP
FED move is the ultimate key.
2018-12-18 15:25