BAT trading update
DividendGuy67
Publish date: Sun, 09 Jun 2024, 04:09 PM
I previously blogged about BAT as an investing candidate here. In that article, I didn't like BAT for long term investing, notwitstanding its high initial dividend yield (due to declining earnings) - I compared that with HLIND and preferred HLIND much more. My only goal is simple - always try to position our portfolio, so that it has the highest chances to keep making new all time highs to beat FD and EPF returns by a margin.
However, looking at BAT's long term monthly charts, price has crashed massively. With that comes short term trading opportunities for sunsetting business like BAT. So, they are small and short term, as they don't carry the same higher convictions that comes from investing. So, 100% pure price charts. 2 different strategy that does not necessarily conflict with my bearish long term fundamental views on BAT.
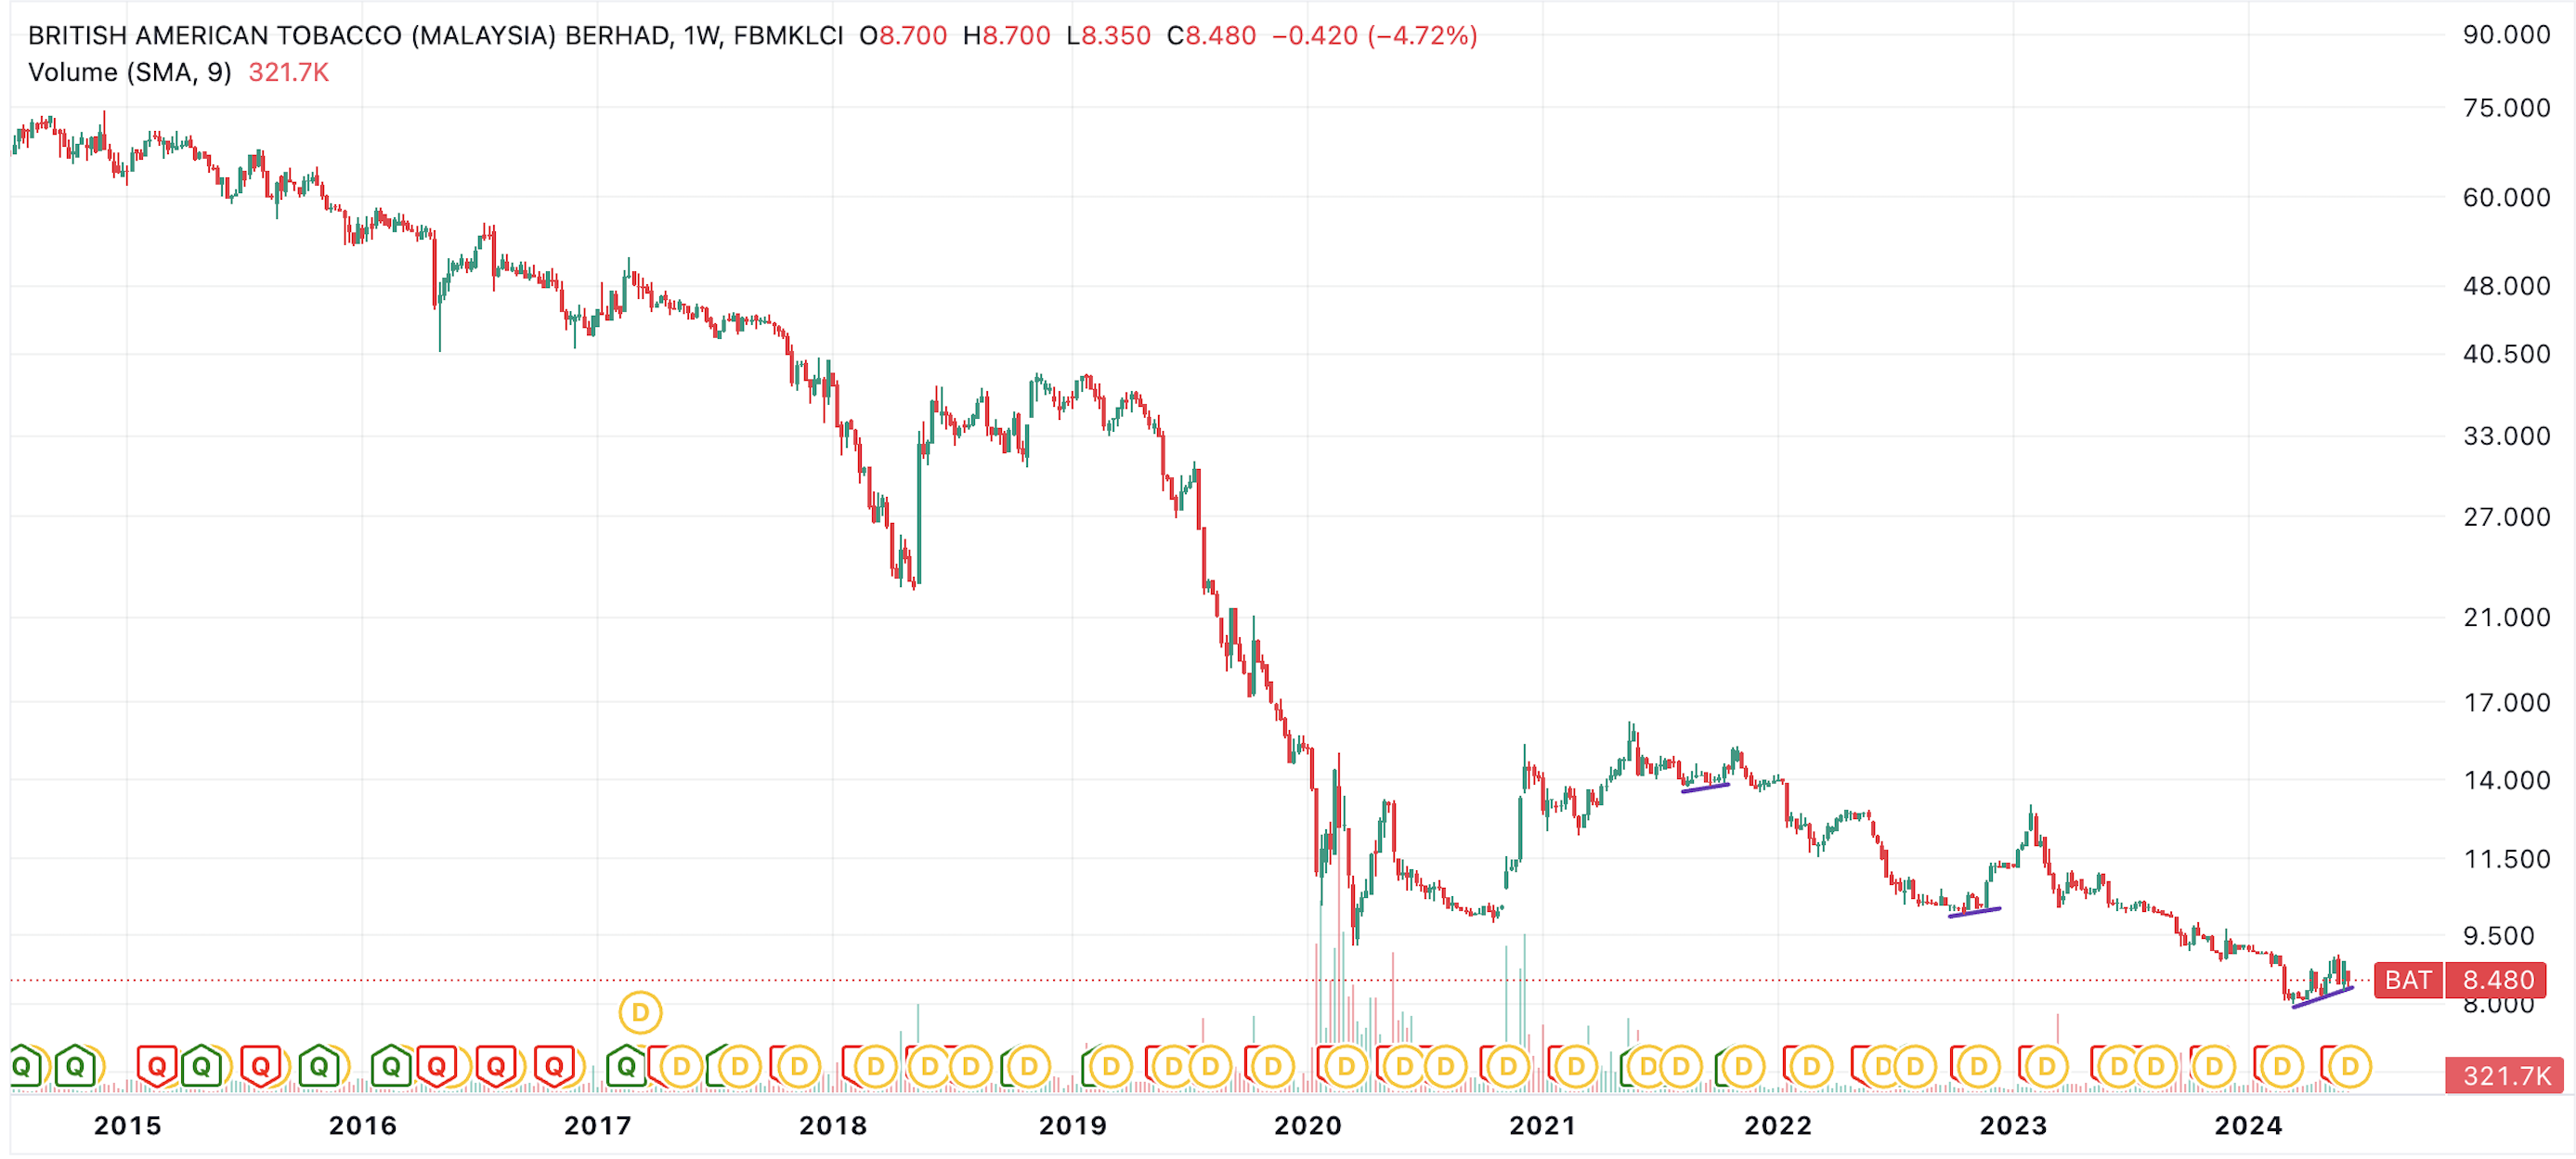
So, here's the chart I'm looking at:
1. Massive long term downtrend - the longer you hold, the higher the odds that you'll lose, as it keeps making new lows. This coincides with my bearish fundamental views and prevents me from "investing" in BAT, vs say HLIND.
2. I believe, the best charts are the ones with minimum technical indicators (here none), and minimum drawings - here, I only draw 3 lines in purple and note the subsequent price actions over the next 2 weeks to 2 months - they clearly indicate short term trades. The 3rd purple line is longer and may not be applicable (i.e. that line may be broken on the downside with say 50/50 chance).
3. My GTC buy limit order last week before it went ex-div was filled at 8.5. It's a small first trade position from nil BAT holdings. (I previously have larger BAT positions which I closed last year at breakeven/very tiny loss on sizeable position size prior). Let's see if this time, it can get to RM9 - if it does (say up to 8.8 to 8.9), it would turn my entire BAT trades post 2021 to be profitable after all commissions and expenses!!! Haha.
4. On the other hand, if it makes a new low, like RAPID, then, I am more likely to make a 2nd trade than stop loss, due to small first (current) position relative to capital.
5. My primary trade rationale is to cure boredom. To force me to sit tight on my much larger investing positions in MAYBANK, TENAGA, MBMR, and 30+ other generally winning investing, high dividend, growing dividend stocks that has a tendency to keep making new all time highs over time and pays dividends along the way. We must not interfere when the bull is running, resting, do small turns before resuming running again (which we actually don't know for sure). So, to supplement investing profits, sometimes, when markets gives a trading setup here like BAT, we take if it allows us to win bigger elsewhere.
Never confuse investing with trading - they are 2 completely different things, for different purposes.

Disclaimer: You are fully responsible for your own trading and investing positions.
More articles on https://dividendguy67.blogspot.com
Discussions
PS2. I have a feeling I may be wrong about this idea and misinterpreted the charts. So, I have earlier placed a GTC sell order at 8.9. I hope, market takes me out at a small profit before this year end.
2024-06-12 00:26


DividendGuy67
PS. In case one wonders how big a position size, I recently added PBBANK at 4.06 at a much larger position, than the current BAT trading position here. This is because over the next 5, 10, 20 years, my conviction on PBBANK at 4.06 is much higher than BAT. My position size reflects my conviction.
2024-06-09 16:23