


KLCI waves
KLCI waves 7

hotstock1975
Publish date: Mon, 18 May 2020, 04:06 AM
hotstock1975
0 101
Elliot wave analysis to measure price behavior for projecting next price actions
Weekly Time Frame
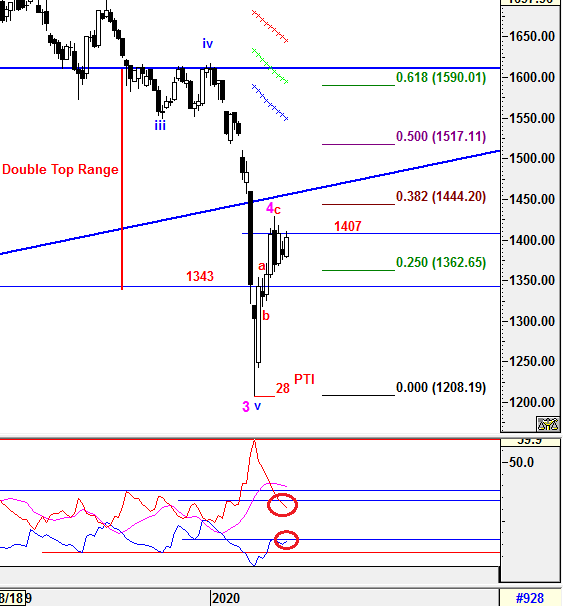
To reiterate from prior session, both bearish formations (Dark Cloud Cover & Bearish Harami) is still valid as KLCI was unable to break above 1407 for initiating any upward move. -DMI is still heading down and +DMI is curving up which both implying bearish momentum is decreasing. However, +DMI up curve has met the resistance where we have to stay caution from now. We have remained the similar viewed that prevailing trend could be emerged if levels listed below was broken:
Immediate Resistance - 1407
Immediate Support - 1369
Daily Time Frame
KLCI is still consolidating within the symmetrical triangle formation. Eventhough, the formation is inclined toward bullish bias but the prior bearish view is still hold since KLCI is yet to breach above the high of minuette sub wave ii at 1418.42. However, DT line has been breached and indicates further upwards may taken place.
Due to contraction signals from daily timeframe, we are still monitoring 2 possible outcomes which either bearish or bullish sentiment might take place if certain critical levels is breached respectively.
a) Bearish view
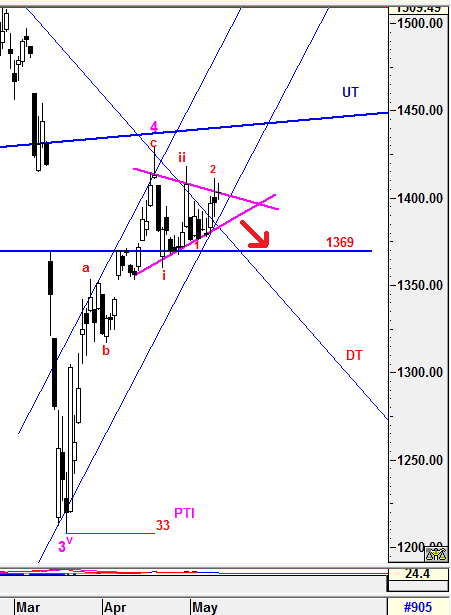
Two lower degree of sub minuette 1 and 2 were formed after failure of breaking the high of minuette sub wave ii at 1418.42. If there's a breakout below the triangle's lower line, it would head towards to test the support 1369. The 3rd minuette sub wave extension downward would be implusive if last support 1369 broken.
a) Bullish view
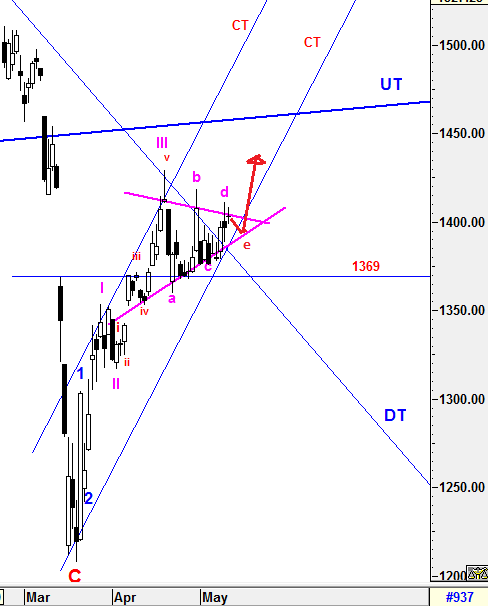
We have narrowed down from 2 to 1 possible formation outcome that the sub 4th wave correction is being constructed as Symmetrical triangle "a-b-c-d-e" minuette waves before sub 5th wave upward.
Therefore, "d" wave has just ended at 1411.08 and next "e" wave would head to lower triangle line at around 1390 before breakout upwards to initiate sub 5th wave up.
Conclusion
As weekly time frame's bearish view is still remained intact, we will be caution when the daily bullish signal is getting stronger which may alter the wave counts and implying that major WAVE C might be ended at 1207.8 and new wave of Bull Run might just started. Nevertheless, we are watching very closely 4 critical levels which will initiate a strong continuous trend towards the waves objective/target.
Critical Resistance - 1418.42
Immediate resistance - 1407
Immediate Support - 1389
Critical Support - 1369
Let's watch how Mr Market path the way.
Wave Believer
More articles on KLCI waves
KLCI waves 94 - WILL THE DOWNWARD PRESSURE TO BE IMPULSIVE TOWARDS WAVE E?
Created by hotstock1975 | Jan 24, 2022
KLCI waves 93 - EXTENSION UPWARD ENDED AND IT'S TIME TO THE DOWNSIDE?
Created by hotstock1975 | Jan 17, 2022
KLCI waves 89 - KLCI WILL EXTEND AND HIT LOWER TARGETS GRADUALLY
Created by hotstock1975 | Dec 20, 2021
Discussions
Be the first to like this. Showing 2 of 2 comments
Closed above 1418.42 convincingly could spur some strength towards upside. Let's see Mr Market is able to pave the way.
2020-05-19 10:58
Post a Comment
Featured Posts
Introducing MY's First IPO Fund for Sophisticated Investors!
New Update. Discover investment communities that resonate with your ideas
M & A Value Partners IPO Equity Fund has been launched - Targeted 13% Return p.a
Latest Videos


Apps


Top Articles
1
CEO Morning Brief
2
南洋行家论股
3
Good Articles to Share
4
5
Good Articles to Share
Expect another 'sluggish' housing market in 2025: Real estate advisor
6
Good Articles to Share
Attorney slams judge over Trump sentencing: ’Constitutionally crippled’ #shorts
7
Good Articles to Share
WATCH LIVE: Former President Jimmy Carter’s funeral services begin
8
Good Articles to Share
Russia declares emergency in Crimea after Black Sea oil spill | REUTERS
#
Stock
Score
Daily Stocks
Stock Name
Last
Change
Volume
Stock Name
Last
Change
Volume
Stock Name
Last
Change
Volume
MQ Trading Signals
Stock
Time
Signal
Duration
No trading signals available.
Stock
Time
Signal
Duration
No trading signals available.
Featured Advertisers / Partners


Ride The Bull Short The Bear
CS Tan
4.9 / 5.0
This book is the result of the author's many years of experience and observation throughout his 26 years in the stockbroking industry. It was written for general public to learn to invest based on facts and not on fantasies or hearsay....
hotstock1975
Both mentioned resistances 1407 and 1418.42 have been broken without creating 'e' wave. It meant the sub 4th wave correction has ended at 'c' wave and sub 5th wave is on it way up. Let's see whether the current momentum can drive it to a potential target of 1450-1460 which is just beneath the UT line shown.
2020-05-19 09:23