


KLCI waves
KLCI waves 16 - Higher Degree of Corrective Waves

hotstock1975
Publish date: Mon, 20 Jul 2020, 12:36 AM
hotstock1975
0 101
Elliot wave analysis to measure price behavior for projecting next price actions
Weekly Time Frame
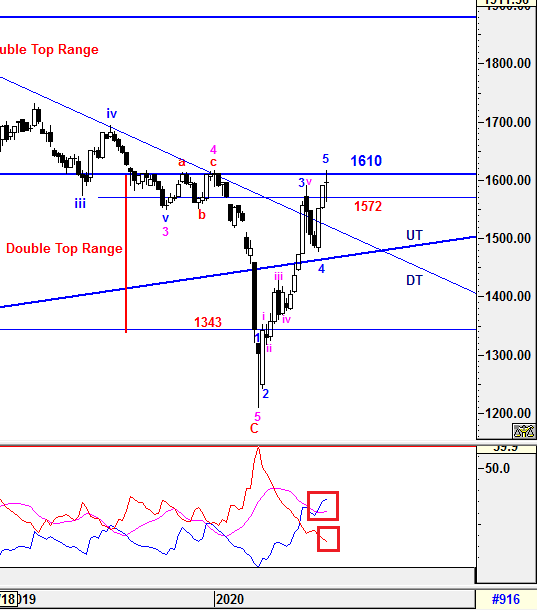
KLCI was unable to sustain above 1610 after reached the high of 1617.36 and formed an doji star which indicated uptrend has been halted. Therefore, the prior Double Top Range effect is yet to be written off.
On the other hand, the higher degree of 5th wave has been completed which will be elaborated further in daily time frame.
-DMI (red line) is still heading down and made new low indicates bearish sentiment is continuing decrease. +DMI (blue line) continued curve up with lower margin indicates bull strenght is slowing down. However, ADX (pink line) is starting to curve up which implying the volatility of the current bull trend is gradually returned. Since the volatility is showing some sign of the current bull trend might continue, i am expecting there would be some knee jerk reaction along the way up.
Prevailing trend could be emerged if levels listed below was broken:
Resistance - 1610
Support - 1572
Daily Time Frame
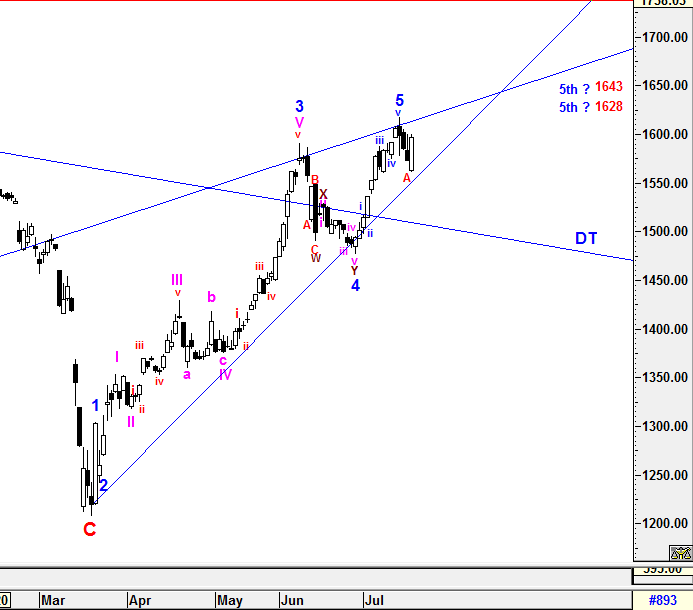
Due to the changes of the magnitude, the minimum criteria level of higher degree of 5th wave has been revised and it realized earlier than expected at 1617.36 instead of 1628.
As expected, 5 sub minutte waves structure was formed to complete higher degree of 5th wave with an complex wave forms structure during 4th sub minutte waves which led to the changes of magnitude. This could be seen at lower time frame instead of daily time frame. However, the minutte waves were able to be labelled clearly in daily time frame.
If the wave counts above is valid, the entire of the impulsive higher degree 5 waves has been realized from the low of 1207.08 to 1617.36. Therefore, higher degree of correction waves could be underway currently and started with sub minutte wave A which was formed at low of 1563.01 (38.2% Fibo). Then, sub minutte wave B is underway with an Bullish Engulfing Formation emerged.
Due to the Bullish Engulfing and ascending wedges formation, i won't rule out that there could be another complex correction waves or even invalidate the current corrections assumption to revisit higher degree of 5th waves at higher level with prior projected target such as 1628 or 1643 if it able to breach above 1617.36 and upper wedges convincingly. Therefore, magnitude of the trend would still be monitored closely and quantified to anticipate any complexity.
All waves' count and projected target are generated based on past/current price level and it may be subjected to vary if degree of momentum movement has changed.
Prevailing trend could be emerged if levels listed below was broken:
Resistance - 1617.36
Immediate resistance - 1610
Immediate support - 1572
Support - 1563.01
To Recap, the Major Classic Bull Run Cycle is still valid and do expect market hiccup or correction waves before a new implusive waves taken place to achieve higher level.
Let's Mr Market pave the waves.
Trade safely
Wave Believer
More articles on KLCI waves
KLCI waves 94 - WILL THE DOWNWARD PRESSURE TO BE IMPULSIVE TOWARDS WAVE E?
Created by hotstock1975 | Jan 24, 2022
KLCI waves 93 - EXTENSION UPWARD ENDED AND IT'S TIME TO THE DOWNSIDE?
Created by hotstock1975 | Jan 17, 2022
KLCI waves 89 - KLCI WILL EXTEND AND HIT LOWER TARGETS GRADUALLY
Created by hotstock1975 | Dec 20, 2021
Featured Posts
Introducing MY's First IPO Fund for Sophisticated Investors!
New Update. Discover investment communities that resonate with your ideas
M & A Value Partners IPO Equity Fund has been launched - Targeted 13% Return p.a
Latest Videos


Apps


Top Articles
1
2
3
Koon Yew Yin's Blog
4
THE INVESTMENT APPROACH OF CALVIN TAN
5
save malaysia!
7
8
CEO Morning Brief
#
Stock
Score
Daily Stocks
Stock Name
Last
Change
Volume
Stock Name
Last
Change
Volume
Stock Name
Last
Change
Volume
MQ Trading Signals
Stock
Time
Signal
Duration
Stock
Time
Signal
Duration
Featured Advertisers / Partners


Ride The Bull Short The Bear
CS Tan
4.9 / 5.0
This book is the result of the author's many years of experience and observation throughout his 26 years in the stockbroking industry. It was written for general public to learn to invest based on facts and not on fantasies or hearsay....