


KLCI waves
KLCI waves 23 - Wave C target is very close

hotstock1975
Publish date: Sun, 06 Sep 2020, 01:02 AM
hotstock1975
0 101
Elliot wave analysis to measure price behavior for projecting next price actions
Weekly Time Frame
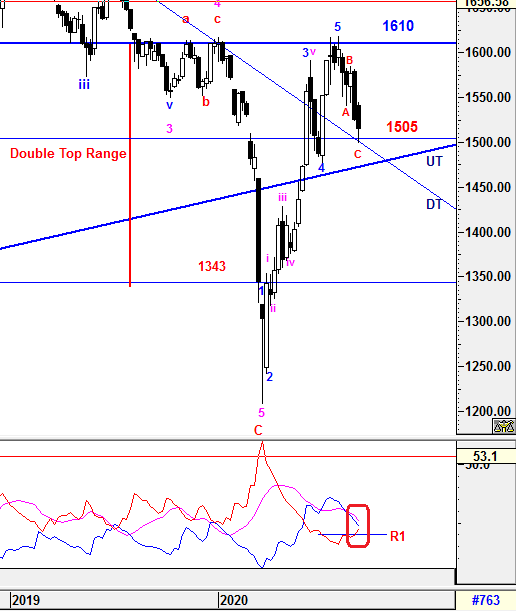
As expected, few rebound atttempts were short live before further downside took place. After subsequent of selling off, KLCI was able to bounce up from DT line and closed above 1505. However, caution is still remained until further signal to justify any trend reversal.
On other hand, the higher degree of correction will be elaborated further in daily time frame.
1) -DMI (red line) continue heading up and broke out above resistance at point R1 indicates bearish momentum is intensify.
2) +DMI (blue line) continue heading down with narrow margin indicates bull strenght is continuing decrease with lower margin.
3) ADX (pink line) is still curving down with greater margin which implying the volatility of the current bull trend is still uncertain and weak.
Therefore, the summations of the 3 signals above is implying uncertainty still remains and knee jerk reaction is unavoidable as expected. Besides that, you may notice that -DMI & +DMI are marginally close to each other and Bull momentum will be faded when +DMI cross below -DMI if selling pressure continue.
Prevailing trend could be emerged if levels listed below was broken:
Resistance - 1610
Immediate Resistance - 1525, 1545
Immediate Support - 1505, 1490 (DT line)
Support - 1485,1475 (UT line)
Daily Time Frame
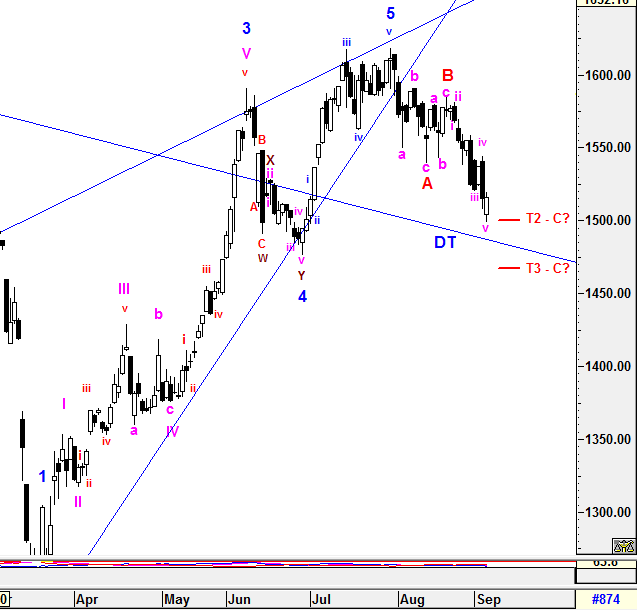
To recap from prior session, each wave A and B were formed with 3 sub minutte waves "abc" and wave C structure could be formed with possible regular 5 sub minutte waves OR 3 sub minutte waves which could lead to Complex waves such as WXY.
From current formation, 5 sub minutte waves had been identified indicates high tendency for wave C (1498.72) has archieved even it exceeded 7 points from pre-determined (T2) target 1506.
From prior session, (T1) and (T2) target levels mentioned had been tested which fit the wave counts' criteria. However, I would not rule out that 3rd target levels (T3) 1457.85 - 1465 (around 1.618% of wave A) may be tested if 1498.72 is broken. If it's emerged, the extension waves formed will be revised on the 5 sub minutte waves.
Therefore, the type of the entire correction formation will be monitored closely as wave C has the most properties of wave forms which may lead to complexity formations.
All waves' count and projected target are generated based on past/current price level and it may be subjected to vary if degree of momentum movement change.
Prevailing trend could be emerged if levels listed below was broken:
Resistance - 1580, 1610
Immediate resistance - 1525, 1545
Immediate support - 1505, 1490 (DT line)
Support - 1485, 1475 (UT line)
=========================================================================
What would happen after wave C ended?
It may lead to a new second Higher Degree of 5 waves bull run OR it could form another higher degree of complex correction waves before the start of new Higher Degree of 5 waves bull run.
==================================================================================================
Let's Mr Market pave the waves.
Trade safely
Wave Believer
More articles on KLCI waves
KLCI waves 94 - WILL THE DOWNWARD PRESSURE TO BE IMPULSIVE TOWARDS WAVE E?
Created by hotstock1975 | Jan 24, 2022
KLCI waves 93 - EXTENSION UPWARD ENDED AND IT'S TIME TO THE DOWNSIDE?
Created by hotstock1975 | Jan 17, 2022
KLCI waves 89 - KLCI WILL EXTEND AND HIT LOWER TARGETS GRADUALLY
Created by hotstock1975 | Dec 20, 2021
Featured Posts
Introducing MY's First IPO Fund for Sophisticated Investors!
New Update. Discover investment communities that resonate with your ideas
M & A Value Partners IPO Equity Fund has been launched - Targeted 13% Return p.a
Latest Videos


Apps


Top Articles
1
The Alpha Trader
3
南洋行家论股
6
Bimb Research Highlights
7
BFM Podcast
8
BFM Podcast
#
Stock
Score
Daily Stocks
Stock Name
Last
Change
Volume
Stock Name
Last
Change
Volume
Stock Name
Last
Change
Volume
MQ Trading Signals
Stock
Time
Signal
Duration
Stock
Time
Signal
Duration
Featured Advertisers / Partners


Ride The Bull Short The Bear
CS Tan
4.9 / 5.0
This book is the result of the author's many years of experience and observation throughout his 26 years in the stockbroking industry. It was written for general public to learn to invest based on facts and not on fantasies or hearsay....