


KLCI waves
KLCI waves 40 - New Set of Implusive Bull Waves or Dead Cat Bounce ? Gloves Stock To Lead on Rotational Growth?

hotstock1975
Publish date: Mon, 11 Jan 2021, 12:14 AM
hotstock1975
0 101
Elliot wave analysis to measure price behavior for projecting next price actions
Weekly Time Frame
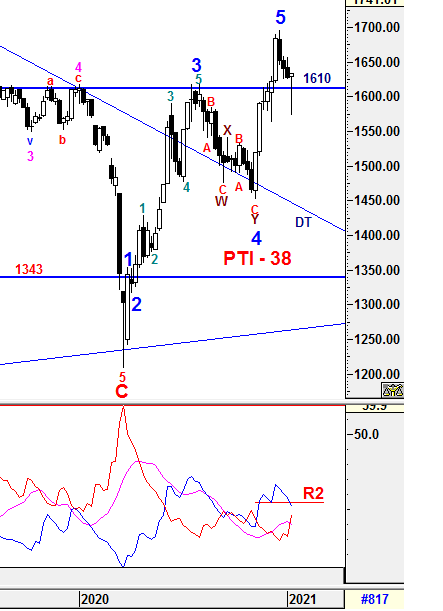
KLCI was able to rebound above 1610 after made a low to 1572.62. Besides that, there was an Hammer candle formed with high volume indicated trend reversal migth be taken place after corrections phase. However, it requires confirmation from next candle to close above 1633.19 convincingly on coming Friday. Therefore, caution is required along the way up for any knee jerk reaction possible before the Bull recharged. Is it the end of correction with a false break below 1610? Let's see on Friday.
To recap, Wave 5 had been confimred which could be realized at higher level since KLCI was trading higher than 1618.01 (Wave 3) and i was expecting Wave 5 could end above 1700 unless there was certain criteria of wave counts breached. No doubt that the wave's criteria level of 1610 emphazised on daily time frame was breached and Wave 5 was confirmed to be realized at 1695.87 instead of 1695.96 high. Subsequent minor waves would be elaborated further in daily time frame.
1) -DMI (red line) curved up with greater margin indicates bearish momentum is increasing.
2) +DMI (blue line) continued heading down with greater margin and break down R2 indicates bull strenght is decreasing shiftly.
3) ADX (pink line) curved down with greater margin implying that the volatility of the current uptrend is decreasing.
Therefore, the summations of the 3 signals above is still implying uncertainty is increasing with greater margin and caution is still required for any unexpected knee jerk reaction. From current situaton, the spread in between +DMI and -DMI is decreasing but +DMI is still above -DMI indicates bull strenght is still in favor with decreasing volatility. Therefore, a continuous increased in ADX reading is still required in order to validate a prominent trend to be developed. Eventhough these indicators showing some weakness, the current price actions with candle formartion signal mentioned above might lead to turn around.
Prevailing trend could be emerged if Weekly levels listed below was broken:
Resistance - 1720
Immediate Resistance - 1639, 1650, 1700
Immediate Support - 1621-1623, 1610
Support - 1577, 1564, 1556,1530, 1490, 1461 (DT line)
Daily Time Frame
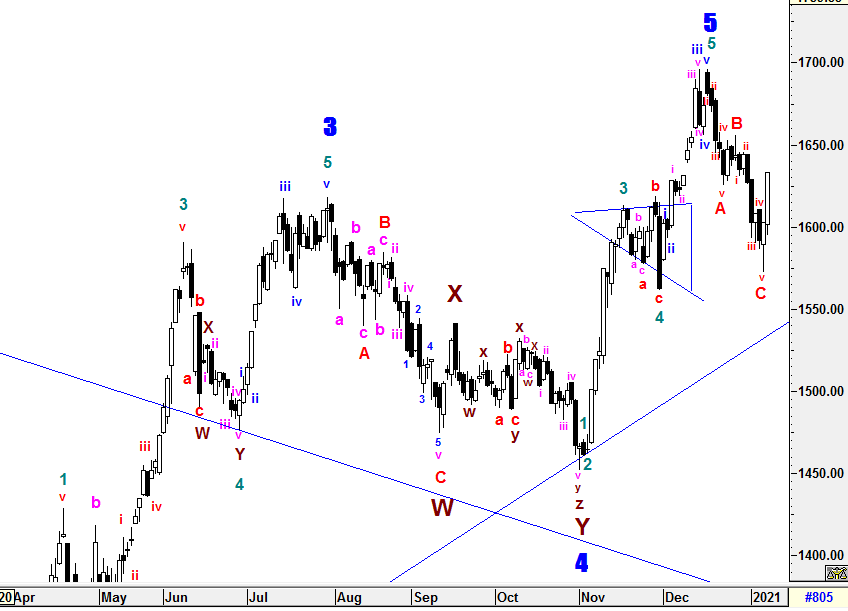
To recap, the prior 3rd projected target of Wave 5 (1706/1730) was still not out of wood yet unless 1610 breached. Due to strong selling momentum continued, 1610 was breached significantly which finalized Wave 5 to be realized at 1695.87 instead of 1695.96 as v sub minuette of 5th sub minuette of 5th minuette waves was an failed v sub minuette wave which PTI reading was only 27 as revised as labelled. Therefore, the entire Higher Degree of Implusive Bull Wave has finally completed which took place from 3/19/2020 to 12/16/2020.
Next, we are in the midst of a new structure of Higher Degree of Correciton which believed to be formed with 5-3-5 structure correction waves [ (i-ii-iii-iv-v (A) - a-b-c - (B) - i-ii-iii-iv-v (C)} as showned. Wave C had been realized at 1572.62 (50% Fibo of Wave 5) and rebound strongly. If the rebound momentum continue and sustainable, implusive Wave 1 could have being formed and confirmation would be validated if it can go towards or breach above Wave B (1655.96). Otherwise, i would consider the current rebound was an dead cat bounce and Complex Correction Waves could be emerged before a new set of Impulsive Bull Waves.
The entire wave structures will still be monitored closely if the low of Wave C at 1572.62 is breached as more complexity wave formations could be emerged such as multiple WXY correction waves may take place before new set of Higher Degree of 5 Waves Bull Run.
All waves' count and projected target are generated based on past/current price level and it may be subjected to vary if degree of momentum movement change.
Prevailing trend could be emerged if Daily levels listed below was broken:
Resistance - 1720
Immediate resistance - 1635-1645, 1650, 1662, 1679, 1685, 1700
Immediate Support - 1620, 1615, 1610, 1597, 1577, 1560, 1554
Support - 1538-1545 (Uptrend line) , 1530, 1490
=========================================================================
I can see major Glove Stocks have also ended the prolong ABC correction which is in line with KLCI waves. Again Could Glove Stock Lead and Initiate an Rotational Play on KLCI Growth?
==========================================================================
Patient is required for the Implusive Waves of the SUPER CYCLE Bull Run.
==========================================================================
Let's Mr Market pave the waves.
Trade safely
Wave Believer
More articles on KLCI waves
KLCI waves 94 - WILL THE DOWNWARD PRESSURE TO BE IMPULSIVE TOWARDS WAVE E?
Created by hotstock1975 | Jan 24, 2022
KLCI waves 93 - EXTENSION UPWARD ENDED AND IT'S TIME TO THE DOWNSIDE?
Created by hotstock1975 | Jan 17, 2022
KLCI waves 89 - KLCI WILL EXTEND AND HIT LOWER TARGETS GRADUALLY
Created by hotstock1975 | Dec 20, 2021
Discussions
Be the first to like this. Showing 0 of 0 comments
Post a Comment
Featured Posts
Introducing MY's First IPO Fund for Sophisticated Investors!
New Update. Discover investment communities that resonate with your ideas
M & A Value Partners IPO Equity Fund has been launched - Targeted 13% Return p.a
Latest Videos


Apps


Top Articles
1
The Alpha Trader
3
CEO Morning Brief
PGF Capital to Distribute Thermal Insulated Panels for Data Centres
4
南洋行家论股
5
Bimb Research Highlights
8
BFM Podcast
#
Stock
Score
Daily Stocks
Stock Name
Last
Change
Volume
Stock Name
Last
Change
Volume
Stock Name
Last
Change
Volume
MQ Trading Signals
Stock
Time
Signal
Duration
Stock
Time
Signal
Duration
Featured Advertisers / Partners


Ride The Bull Short The Bear
CS Tan
4.9 / 5.0
This book is the result of the author's many years of experience and observation throughout his 26 years in the stockbroking industry. It was written for general public to learn to invest based on facts and not on fantasies or hearsay....